> ## Documentation Index
> Fetch the complete documentation index at: https://docs.get-clara.tech/llms.txt
> Use this file to discover all available pages before exploring further.

# Configuración del gráfico

> Configura tus gráficos para mostrar los datos exactamente como los necesitas.

export const ChartIcon = ({icon, size = 20}) => {
  const icons = {
    'database': <svg xmlns="http://www.w3.org/2000/svg" width={size} height={size} viewBox="0 0 24 24" fill="none" stroke="currentColor" strokeWidth="2" strokeLinecap="round" strokeLinejoin="round">
        <path stroke="none" d="M0 0h24v24H0z" fill="none" />
        <path d="M4 6a8 3 0 1 0 16 0a8 3 0 1 0 -16 0" />
        <path d="M4 6v6a8 3 0 0 0 16 0v-6" />
        <path d="M4 12v6a8 3 0 0 0 16 0v-6" />
      </svg>,
    'filter': <svg xmlns="http://www.w3.org/2000/svg" width={size} height={size} viewBox="0 0 24 24" fill="none" stroke="currentColor" strokeWidth="2" strokeLinecap="round" strokeLinejoin="round">
        <path stroke="none" d="M0 0h24v24H0z" fill="none" />
        <path d="M4 4h16v2.172a2 2 0 0 1 -.586 1.414l-4.414 4.414v7l-6 2v-8.5l-4.48 -4.928a2 2 0 0 1 -.52 -1.345v-2.227" />
      </svg>,
    'axis-x': <svg xmlns="http://www.w3.org/2000/svg" width={size} height={size} viewBox="0 0 24 24" fill="none" stroke="currentColor" strokeWidth="2" strokeLinecap="round" strokeLinejoin="round">
        <path stroke="none" d="M0 0h24v24H0z" fill="none" />
        <path d="M4 13v.01" />
        <path d="M4 9v.01" />
        <path d="M4 5v.01" />
        <path d="M17 20l3 -3l-3 -3" />
        <path d="M4 17h16" />
      </svg>,
    'axis-y': <svg xmlns="http://www.w3.org/2000/svg" width={size} height={size} viewBox="0 0 24 24" fill="none" stroke="currentColor" strokeWidth="2" strokeLinecap="round" strokeLinejoin="round">
        <path stroke="none" d="M0 0h24v24H0z" fill="none" />
        <path d="M11 20h-.01" />
        <path d="M15 20h-.01" />
        <path d="M19 20h-.01" />
        <path d="M4 7l3 -3l3 3" />
        <path d="M7 20v-16" />
      </svg>,
    'sum': <svg xmlns="http://www.w3.org/2000/svg" width={size} height={size} viewBox="0 0 24 24" fill="none" stroke="currentColor" strokeWidth="2" strokeLinecap="round" strokeLinejoin="round">
        <path stroke="none" d="M0 0h24v24H0z" fill="none" />
        <path d="M18 16v2a1 1 0 0 1 -1 1h-11l6 -7l-6 -7h11a1 1 0 0 1 1 1v2" />
      </svg>,
    'chart-pie': <svg xmlns="http://www.w3.org/2000/svg" width={size} height={size} viewBox="0 0 24 24" fill="none" stroke="currentColor" strokeWidth="2" strokeLinecap="round" strokeLinejoin="round">
        <path stroke="none" d="M0 0h24v24H0z" fill="none" />
        <path d="M10 3.2a9 9 0 1 0 10.8 10.8a1 1 0 0 0 -1 -1h-6.8a2 2 0 0 1 -2 -2v-7a.9 .9 0 0 0 -1 -.8" />
        <path d="M15 3.5a9 9 0 0 1 5.5 5.5h-4.5a1 1 0 0 1 -1 -1v-4.5" />
      </svg>,
    'chart-line': <svg xmlns="http://www.w3.org/2000/svg" width={size} height={size} viewBox="0 0 24 24" fill="none" stroke="currentColor" strokeWidth="2" strokeLinecap="round" strokeLinejoin="round">
        <path stroke="none" d="M0 0h24v24H0z" fill="none" />
        <path d="M4 19l16 0" />
        <path d="M4 15l4 -6l4 2l4 -5l4 4" />
      </svg>,
    'calendar': <svg xmlns="http://www.w3.org/2000/svg" width={size} height={size} viewBox="0 0 24 24" fill="none" stroke="currentColor" strokeWidth="2" strokeLinecap="round" strokeLinejoin="round">
        <path stroke="none" d="M0 0h24v24H0z" fill="none" />
        <path d="M4 7a2 2 0 0 1 2 -2h12a2 2 0 0 1 2 2v12a2 2 0 0 1 -2 2h-12a2 2 0 0 1 -2 -2v-12" />
        <path d="M16 3v4" />
        <path d="M8 3v4" />
        <path d="M4 11h16" />
        <path d="M11 15h1" />
        <path d="M12 15v3" />
      </svg>,
    'arrows-sort': <svg xmlns="http://www.w3.org/2000/svg" width={size} height={size} viewBox="0 0 24 24" fill="none" stroke="currentColor" strokeWidth="2" strokeLinecap="round" strokeLinejoin="round">
        <path stroke="none" d="M0 0h24v24H0z" fill="none" />
        <path d="M3 9l4 -4l4 4m-4 -4v14" />
        <path d="M21 15l-4 4l-4 -4m4 4v-14" />
      </svg>,
    'filters': <svg xmlns="http://www.w3.org/2000/svg" width={size} height={size} viewBox="0 0 24 24" fill="none" stroke="currentColor" strokeWidth="2" strokeLinecap="round" strokeLinejoin="round">
        <path stroke="none" d="M0 0h24v24H0z" fill="none" />
        <path d="M7 8a5 5 0 1 0 10 0a5 5 0 1 0 -10 0" />
        <path d="M8 11a5 5 0 1 0 3.998 1.997" />
        <path d="M12.002 19.003a5 5 0 1 0 3.998 -8.003" />
      </svg>,
    'chart-bar-popular': <svg xmlns="http://www.w3.org/2000/svg" width={size} height={size} viewBox="0 0 24 24" fill="none" stroke="currentColor" strokeWidth="2" strokeLinecap="round" strokeLinejoin="round">
        <path stroke="none" d="M0 0h24v24H0z" fill="none" />
        <path d="M3 13a1 1 0 0 1 1 -1h4a1 1 0 0 1 1 1v6a1 1 0 0 1 -1 1h-4a1 1 0 0 1 -1 -1l0 -6" />
        <path d="M9 9a1 1 0 0 1 1 -1h4a1 1 0 0 1 1 1v10a1 1 0 0 1 -1 1h-4a1 1 0 0 1 -1 -1l0 -10" />
        <path d="M15 5a1 1 0 0 1 1 -1h4a1 1 0 0 1 1 1v14a1 1 0 0 1 -1 1h-4a1 1 0 0 1 -1 -1l0 -14" />
        <path d="M4 20h14" />
      </svg>,
    'math-min': <svg xmlns="http://www.w3.org/2000/svg" width={size} height={size} viewBox="0 0 24 24" fill="none" stroke="currentColor" strokeWidth="2" strokeLinecap="round" strokeLinejoin="round">
        <path stroke="none" d="M0 0h24v24H0z" fill="none" />
        <path d="M15 18a2 2 0 1 0 4 0a2 2 0 0 0 -4 0" />
        <path d="M3 13s1 -9 4 -9c2.48 0 5.643 9.565 8.36 12.883" />
        <path d="M18.748 17.038c.702 -.88 1.452 -3.56 2.252 -8.038" />
      </svg>,
    'math-max': <svg xmlns="http://www.w3.org/2000/svg" width={size} height={size} viewBox="0 0 24 24" fill="none" stroke="currentColor" strokeWidth="2" strokeLinecap="round" strokeLinejoin="round">
        <path stroke="none" d="M0 0h24v24H0z" fill="none" />
        <path d="M5 6a2 2 0 1 0 4 0a2 2 0 0 0 -4 0" />
        <path d="M3 15s.616 -5.544 2.332 -7.93" />
        <path d="M8.637 7.112c2.717 3.313 5.882 12.888 8.363 12.888c2 0 3.333 -3 4 -9" />
      </svg>,
    'color-swatch': <svg xmlns="http://www.w3.org/2000/svg" width={size} height={size} viewBox="0 0 24 24" fill="none" stroke="currentColor" strokeWidth="2" strokeLinecap="round" strokeLinejoin="round">
        <path stroke="none" d="M0 0h24v24H0z" fill="none" />
        <path d="M19 3h-4a2 2 0 0 0 -2 2v12a4 4 0 0 0 8 0v-12a2 2 0 0 0 -2 -2" />
        <path d="M13 7.35l-2 -2a2 2 0 0 0 -2.828 0l-2.828 2.828a2 2 0 0 0 0 2.828l9 9" />
        <path d="M7.3 13h-2.3a2 2 0 0 0 -2 2v4a2 2 0 0 0 2 2h12" />
        <path d="M17 17l0 .01" />
      </svg>,
    'gizmo': <svg xmlns="http://www.w3.org/2000/svg" width={size} height={size} viewBox="0 0 24 24" fill="none" stroke="currentColor" strokeWidth="2" strokeLinecap="round" strokeLinejoin="round">
        <path stroke="none" d="M0 0h24v24H0z" fill="none" />
        <path d="M20 19l-8 -5.5l-8 5.5" />
        <path d="M12 4v9.5" />
        <path d="M11 4a1 1 0 1 0 2 0a1 1 0 1 0 -2 0" />
        <path d="M3 19a1 1 0 1 0 2 0a1 1 0 1 0 -2 0" />
        <path d="M19 19a1 1 0 1 0 2 0a1 1 0 1 0 -2 0" />
      </svg>,
    'stack-2': <svg xmlns="http://www.w3.org/2000/svg" width={size} height={size} viewBox="0 0 24 24" fill="none" stroke="currentColor" strokeWidth="2" strokeLinecap="round" strokeLinejoin="round">
        <path stroke="none" d="M0 0h24v24H0z" fill="none" />
        <path d="M12 4l-8 4l8 4l8 -4l-8 -4" />
        <path d="M4 12l8 4l8 -4" />
        <path d="M4 16l8 4l8 -4" />
      </svg>,
    'badge-2k': <svg xmlns="http://www.w3.org/2000/svg" width={size} height={size} viewBox="0 0 24 24" fill="none" stroke="currentColor" strokeWidth="2" strokeLinecap="round" strokeLinejoin="round">
        <path stroke="none" d="M0 0h24v24H0z" fill="none" />
        <path d="M3 7a2 2 0 0 1 2 -2h14a2 2 0 0 1 2 2v10a2 2 0 0 1 -2 2h-14a2 2 0 0 1 -2 -2l0 -10" />
        <path d="M14 9v6" />
        <path d="M17 9l-2 3l2 3" />
        <path d="M15 12h-1" />
        <path d="M7 9h2a1 1 0 0 1 1 1v1a1 1 0 0 1 -1 1h-1a1 1 0 0 0 -1 1v1a1 1 0 0 0 1 1h2" />
      </svg>,
    'text-caption': <svg xmlns="http://www.w3.org/2000/svg" width={size} height={size} viewBox="0 0 24 24" fill="none" stroke="currentColor" strokeWidth="2" strokeLinecap="round" strokeLinejoin="round">
        <path stroke="none" d="M0 0h24v24H0z" fill="none" />
        <path d="M4 15h16" />
        <path d="M4 5a1 1 0 0 1 1 -1h4a1 1 0 0 1 1 1v4a1 1 0 0 1 -1 1h-4a1 1 0 0 1 -1 -1l0 -4" />
        <path d="M4 20h12" />
      </svg>,
    'eye-off': <svg xmlns="http://www.w3.org/2000/svg" width={size} height={size} viewBox="0 0 24 24" fill="none" stroke="currentColor" strokeWidth="2" strokeLinecap="round" strokeLinejoin="round">
        <path stroke="none" d="M0 0h24v24H0z" fill="none" />
        <path d="M10.585 10.587a2 2 0 0 0 2.829 2.828" />
        <path d="M16.681 16.673a8.717 8.717 0 0 1 -4.681 1.327c-3.6 0 -6.6 -2 -9 -6c1.272 -2.12 2.712 -3.678 4.32 -4.674m2.86 -1.146a9.055 9.055 0 0 1 1.82 -.18c3.6 0 6.6 2 9 6c-.666 1.11 -1.379 2.067 -2.138 2.87" />
        <path d="M3 3l18 18" />
      </svg>,
    'caret-left': <svg xmlns="http://www.w3.org/2000/svg" width={size} height={size} viewBox="0 0 24 24" fill="none" stroke="currentColor" strokeWidth="2" strokeLinecap="round" strokeLinejoin="round">
        <path stroke="none" d="M0 0h24v24H0z" fill="none" />
        <path d="M14 6l-6 6l6 6v-12" />
      </svg>,
    'caret-right': <svg xmlns="http://www.w3.org/2000/svg" width={size} height={size} viewBox="0 0 24 24" fill="none" stroke="currentColor" strokeWidth="2" strokeLinecap="round" strokeLinejoin="round">
        <path stroke="none" d="M0 0h24v24H0z" fill="none" />
        <path d="M10 18l6 -6l-6 -6v12" />
      </svg>,
    'number-123': <svg xmlns="http://www.w3.org/2000/svg" width={size} height={size} viewBox="0 0 24 24" fill="none" stroke="currentColor" strokeWidth="2" strokeLinecap="round" strokeLinejoin="round">
        <path stroke="none" d="M0 0h24v24H0z" fill="none" />
        <path d="M3 10l2 -2v8" />
        <path d="M9 8h3a1 1 0 0 1 1 1v2a1 1 0 0 1 -1 1h-2a1 1 0 0 0 -1 1v2a1 1 0 0 0 1 1h3" />
        <path d="M17 8h2.5a1.5 1.5 0 0 1 1.5 1.5v1a1.5 1.5 0 0 1 -1.5 1.5h-1.5h1.5a1.5 1.5 0 0 1 1.5 1.5v1a1.5 1.5 0 0 1 -1.5 1.5h-2.5" />
      </svg>,
    'frame': <svg xmlns="http://www.w3.org/2000/svg" width={size} height={size} viewBox="0 0 24 24" fill="none" stroke="currentColor" strokeWidth="2" strokeLinecap="round" strokeLinejoin="round">
        <path stroke="none" d="M0 0h24v24H0z" fill="none" />
        <path d="M4 7l16 0" />
        <path d="M4 17l16 0" />
        <path d="M7 4l0 16" />
        <path d="M17 4l0 16" />
      </svg>,
    'align-box-left-top': <svg xmlns="http://www.w3.org/2000/svg" width={size} height={size} viewBox="0 0 24 24" fill="none" stroke="currentColor" strokeWidth="2" strokeLinecap="round" strokeLinejoin="round">
        <path stroke="none" d="M0 0h24v24H0z" fill="none" />
        <path d="M3 5a2 2 0 0 1 2 -2h14a2 2 0 0 1 2 2v14a2 2 0 0 1 -2 2h-14a2 2 0 0 1 -2 -2v-14" />
        <path d="M9 13h-2" />
        <path d="M13 10h-6" />
        <path d="M11 7h-4" />
      </svg>
  };
  const selectedIcon = icons[icon];
  if (!selectedIcon) {
    return null;
  }
  return selectedIcon;
};

## Acceder a la configuración del gráfico

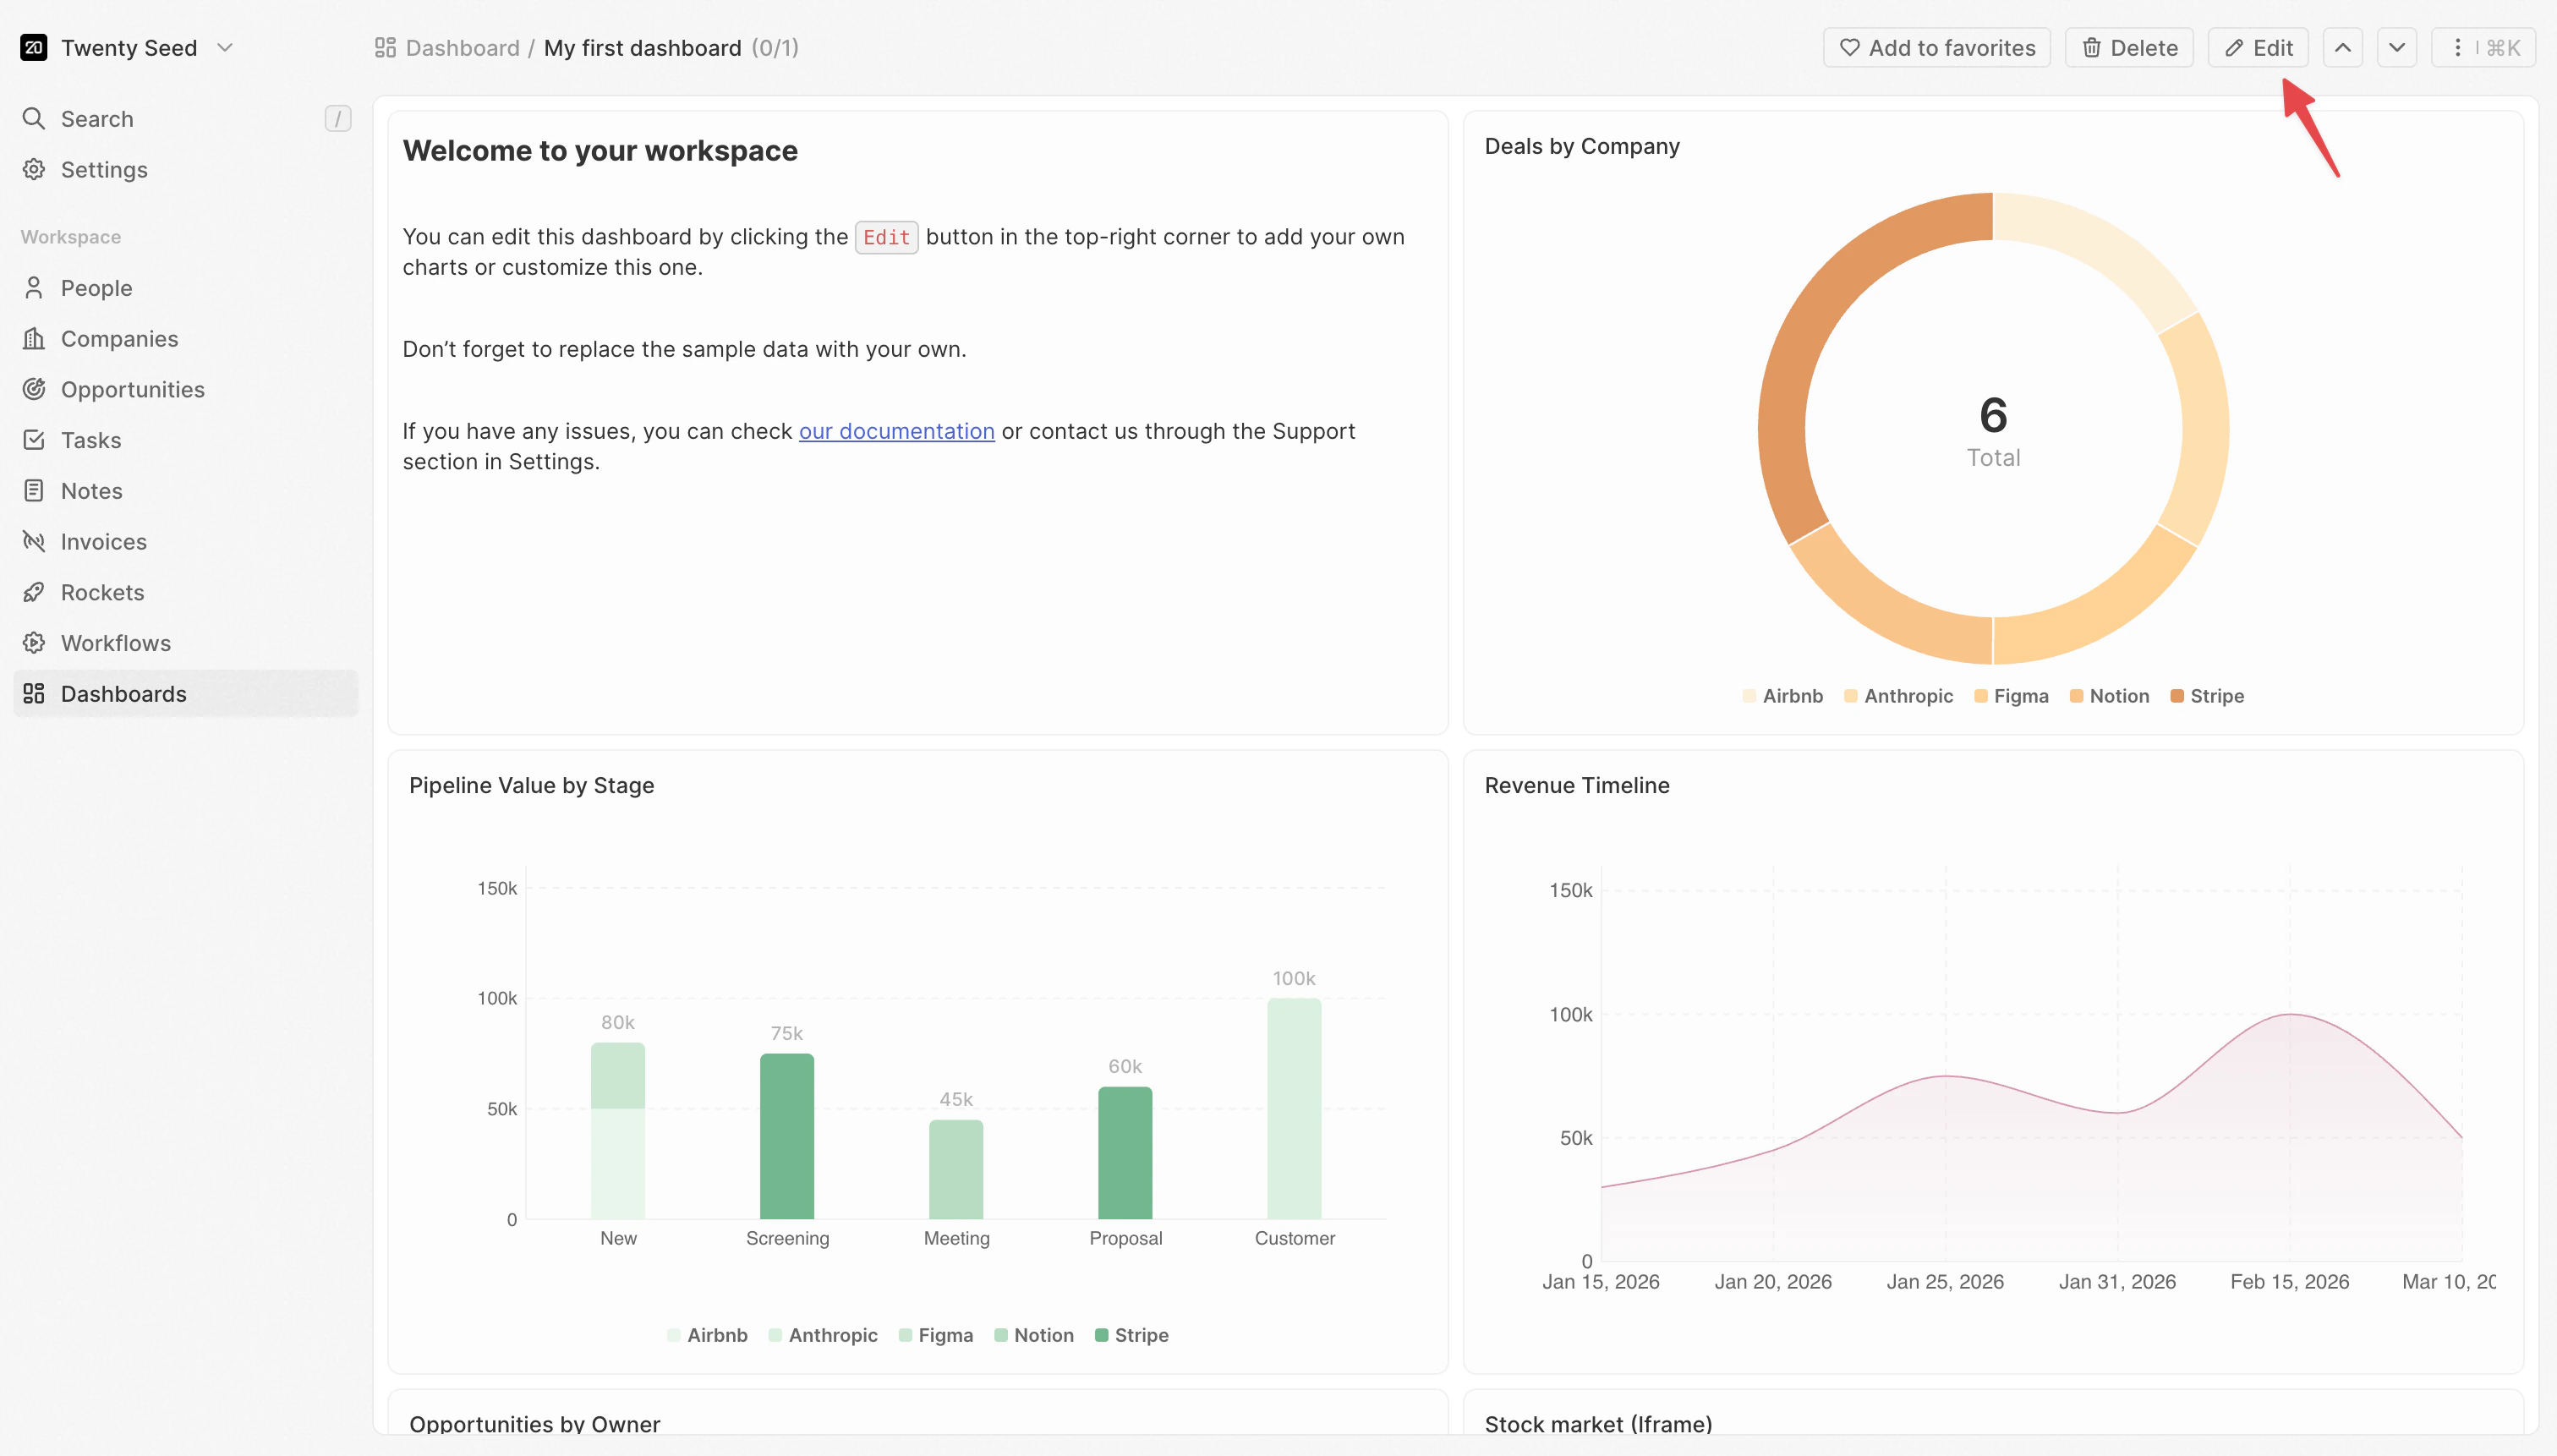
1. Haz clic en el botón **Edit** en la esquina superior derecha de tu panel

<img src="https://mintcdn.com/clara-1b8b12e1/nw6qFuBqeI4qyyh5/images/user-guide/dashboard/dashboard-edit.png?fit=max&auto=format&n=nw6qFuBqeI4qyyh5&q=85&s=392cdb9a6e32036b1f252ee017eb820f" alt="Modo de edición" width="3024" height="1722" data-path="images/user-guide/dashboard/dashboard-edit.png" />

2. El panel entra en modo de edición
3. Haz clic en cualquier widget para seleccionarlo
4. El panel de configuración se abre a la derecha

La configuración está organizada en secciones:

* **Datos**: qué datos obtener y cómo filtrarlos
* **Eje X**: cómo agrupar y ordenar categorías (gráficos de barras/líneas)
* **Eje Y**: qué medir y cómo mostrarlo (gráficos de barras/líneas)
* **Estilo**: colores, etiquetas y opciones visuales

<Note>
  Algunas configuraciones solo aparecen cuando se configuran otras. Por ejemplo, **Granularidad de fecha** solo aparece cuando seleccionas un campo de fecha.
</Note>

***

## Configuración de datos

### <span style={{ display: 'inline-flex', alignItems: 'center', gap: '8px' }}> <ChartIcon icon="database" />Origen </span>

Elige de qué objeto extraer datos.

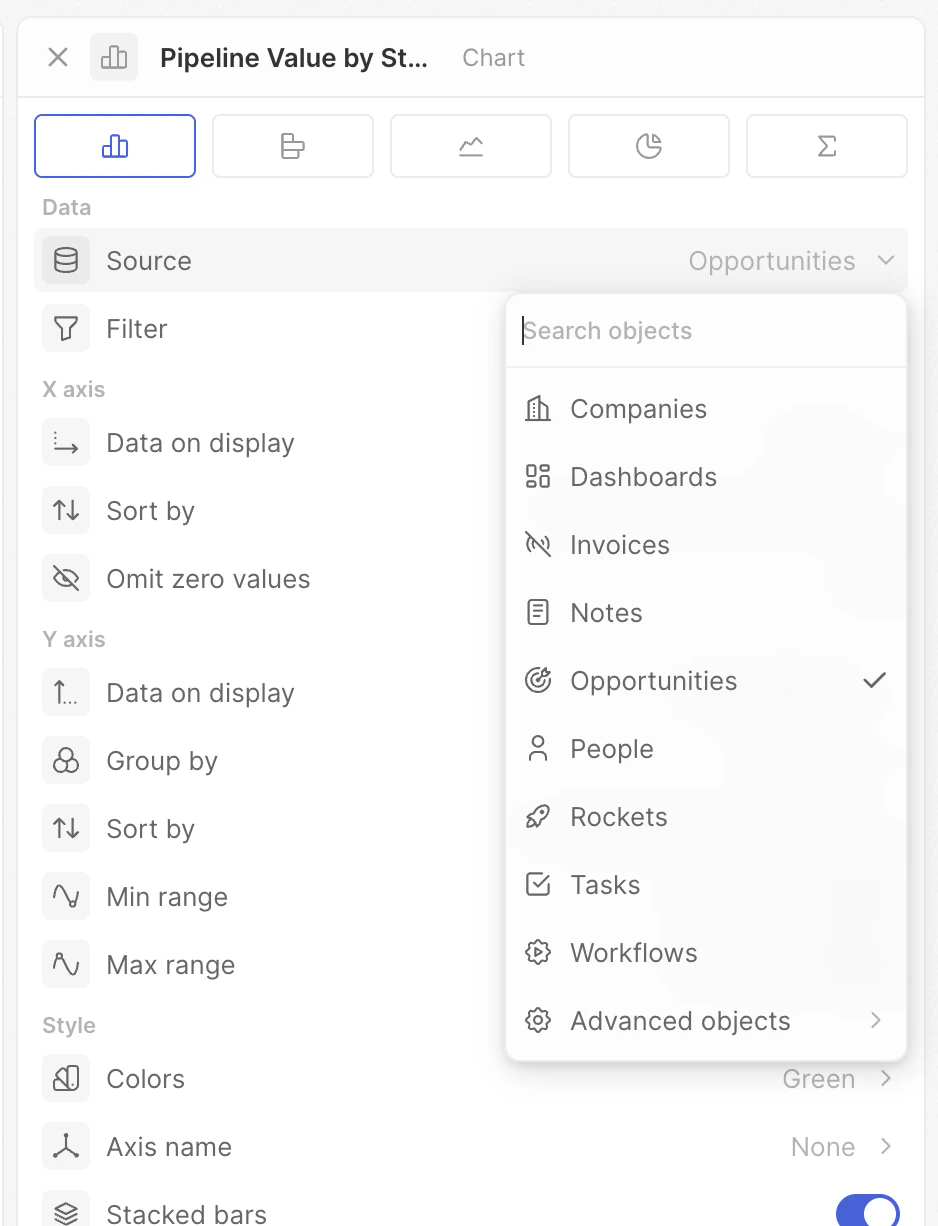
1. Haz clic en **Source**
2. Selecciona un objeto (Oportunidades, Personas, Empresas, etc.)

Todos tus objetos estándar y personalizados están disponibles. Cambiar el origen restablece otras configuraciones, ya que las opciones de campo dependen del objeto seleccionado.

<img src="https://mintcdn.com/clara-1b8b12e1/nw6qFuBqeI4qyyh5/images/user-guide/dashboard/dashboard-chart-settings-source.png?fit=max&auto=format&n=nw6qFuBqeI4qyyh5&q=85&s=3fb95da16784d7371600e1f829cf2f0c" alt="Fuente" width="938" height="1226" data-path="images/user-guide/dashboard/dashboard-chart-settings-source.png" />

### <span style={{ display: 'inline-flex', alignItems: 'center', gap: '8px' }}> <ChartIcon icon="filter" />Filtro </span>

Limita qué registros se incluyen en el gráfico.

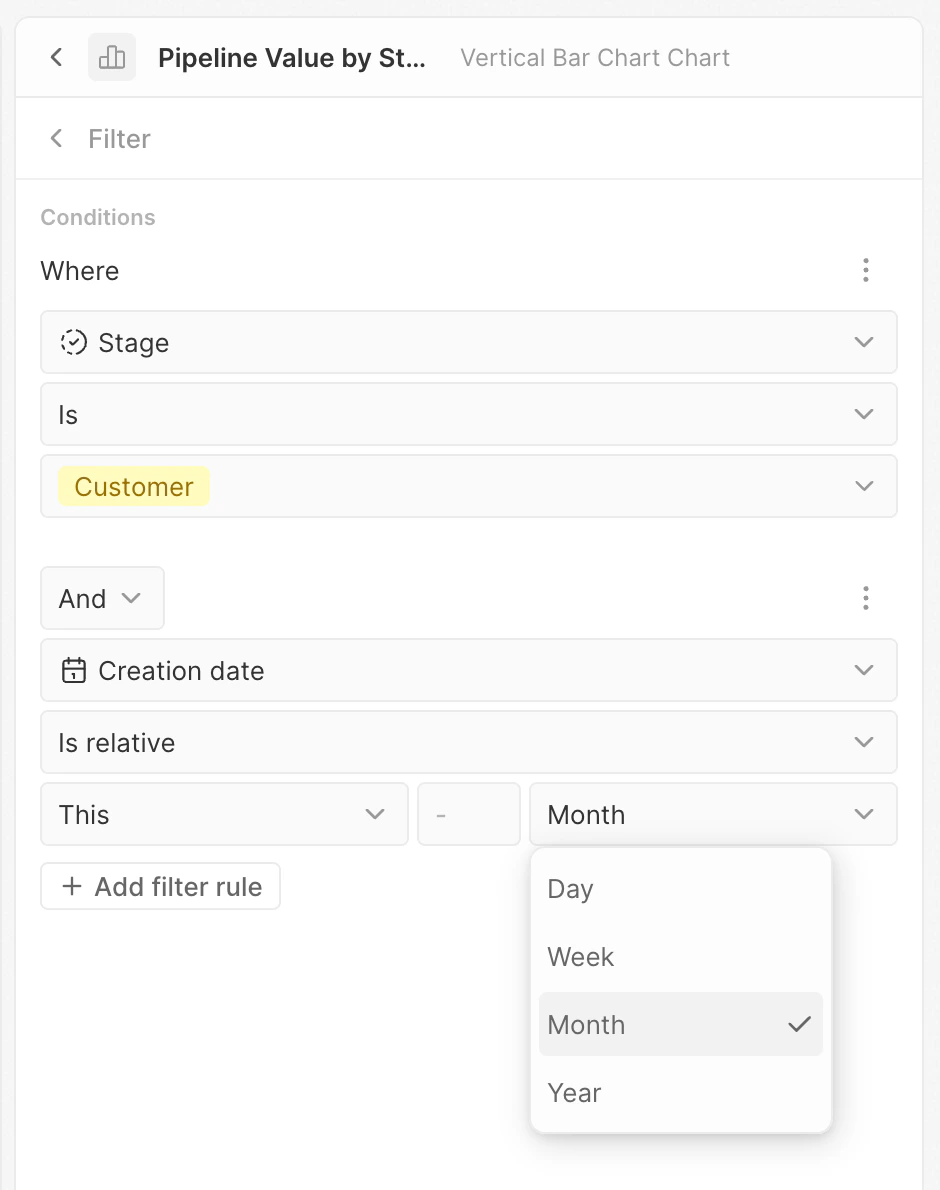
1. Haz clic en **Filtrar**
2. Se abre el generador de filtros
3. Haz clic en **+ Add filter**
4. Selecciona un campo, una condición y un valor
5. Agrega más filtros según sea necesario

Los filtros funcionan igual que en las vistas de tabla. Úsalos para enfocarte en segmentos específicos de tus datos.

**Ejemplo**: filtra oportunidades donde Stage sea "Won" para mostrar solo los acuerdos cerrados.

<img src="https://mintcdn.com/clara-1b8b12e1/nw6qFuBqeI4qyyh5/images/user-guide/dashboard/dashboard-chart-settings-filters.png?fit=max&auto=format&n=nw6qFuBqeI4qyyh5&q=85&s=eda97aea77fbb2921a977a90ecfc7f27" alt="Filtro" width="940" height="1190" data-path="images/user-guide/dashboard/dashboard-chart-settings-filters.png" />

<Tip>
  Para campos de fecha, prueba **Is relative** para crear filtros dinámicos como "Past 7 days" o "This month" que se actualizan automáticamente.
</Tip>

<Tip>
  Se admiten filtros avanzados—agrega varias reglas de filtro y combínalas con lógica **And** u **Or**.
</Tip>

***

## Configuración del eje X

Estas configuraciones controlan el eje horizontal de los gráficos de barras y líneas—normalmente cómo se agrupan tus datos en categorías.

### <span style={{ display: 'inline-flex', alignItems: 'center', gap: '8px' }}> <ChartIcon icon="axis-x" />Datos en pantalla </span>

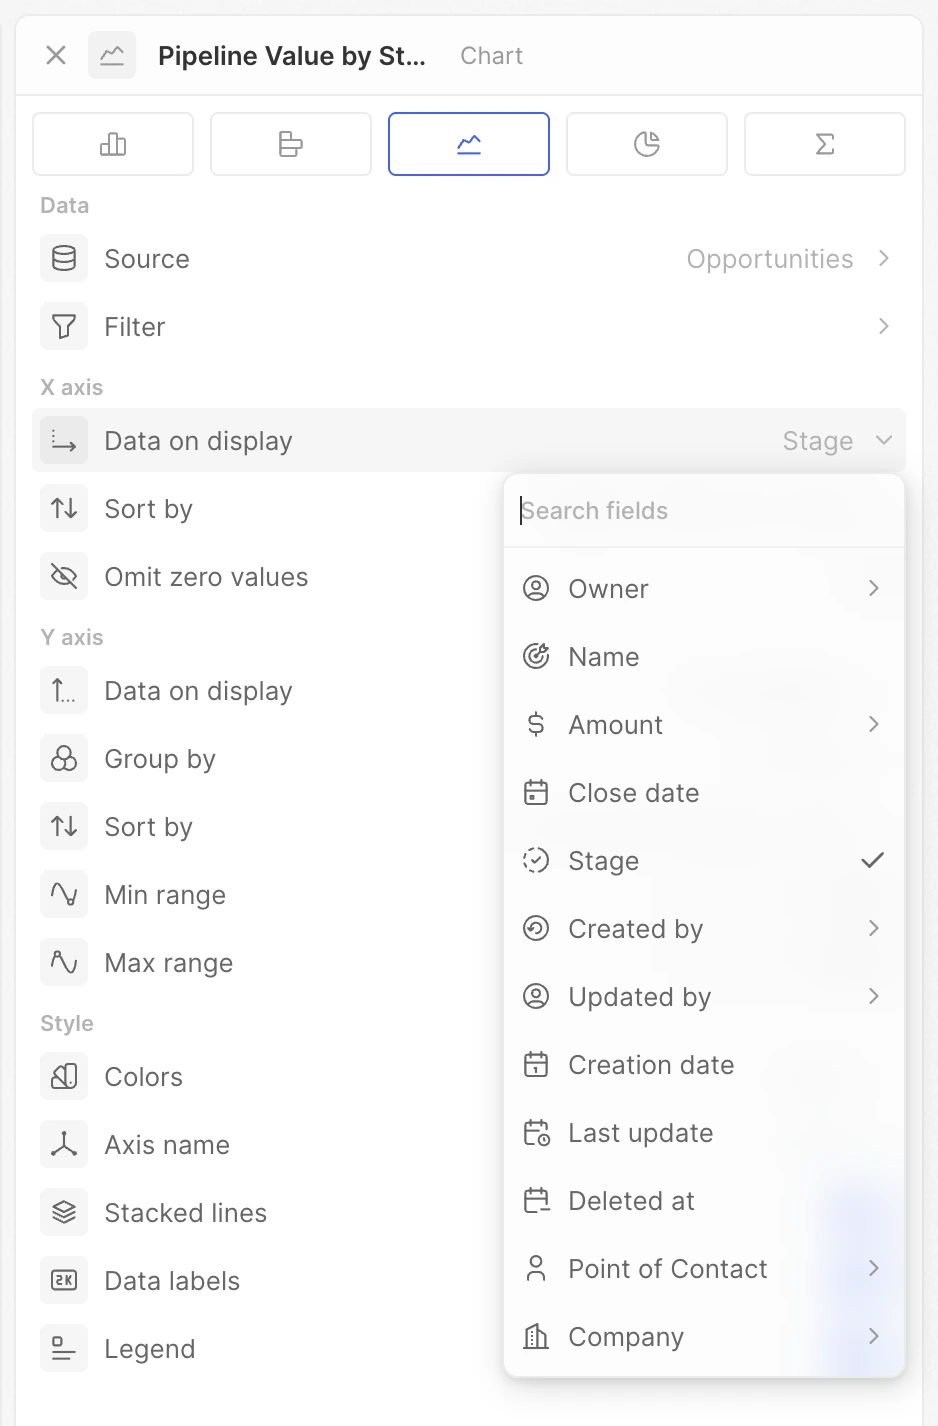
Selecciona el campo por el que agrupar tus datos. Esto determina las categorías que se muestran en el eje X.

**Ejemplo**: selecciona "Stage" para ver los datos agrupados por etapa del pipeline, o "Created date" para ver los datos a lo largo del tiempo.

<img src="https://mintcdn.com/clara-1b8b12e1/nw6qFuBqeI4qyyh5/images/user-guide/dashboard/dashboard-chart-settings-x-data-on-display.png?fit=max&auto=format&n=nw6qFuBqeI4qyyh5&q=85&s=130b7729bd8959070127245cadfd3d25" alt="Datos en pantalla" width="938" height="1426" data-path="images/user-guide/dashboard/dashboard-chart-settings-x-data-on-display.png" />

### <span style={{ display: 'inline-flex', alignItems: 'center', gap: '8px' }}> <ChartIcon icon="calendar" />Granularidad de fecha </span>

Al agrupar por un campo de fecha, elige el período de tiempo para agrupar.

| Opción                | Agrupa los datos por        | Salida de ejemplo                               |
| --------------------- | --------------------------- | ----------------------------------------------- |
| **Día**               | Cada día del calendario     | 1 ene, 2 ene, 3 ene...                          |
| **Semana**            | Semanas del calendario      | Semana 1, Semana 2, Semana 3...                 |
| **Mes**               | Meses del calendario        | enero, febrero, marzo...                        |
| **Trimestre**         | Trimestres fiscales         | Q1, Q2, Q3, Q4                                  |
| **Año**               | Años del calendario         | 2023, 2024, 2025                                |
| **Día de la semana**  | Día de la semana (agregado) | lunes, martes... (todos los lunes combinados)   |
| **Mes del año**       | Mes (agregado)              | enero, febrero... (todos los eneros combinados) |
| **Trimestre del año** | Trimestre (agregado)        | Q1, Q2, Q3, Q4 (todos los Q1 combinados)        |

Las opciones "de semana/año" agregan a lo largo de todo el tiempo. Usa **Día de la semana** para ver qué día suele obtener más acuerdos. Usa **Mes** para ver tendencias mes a mes.

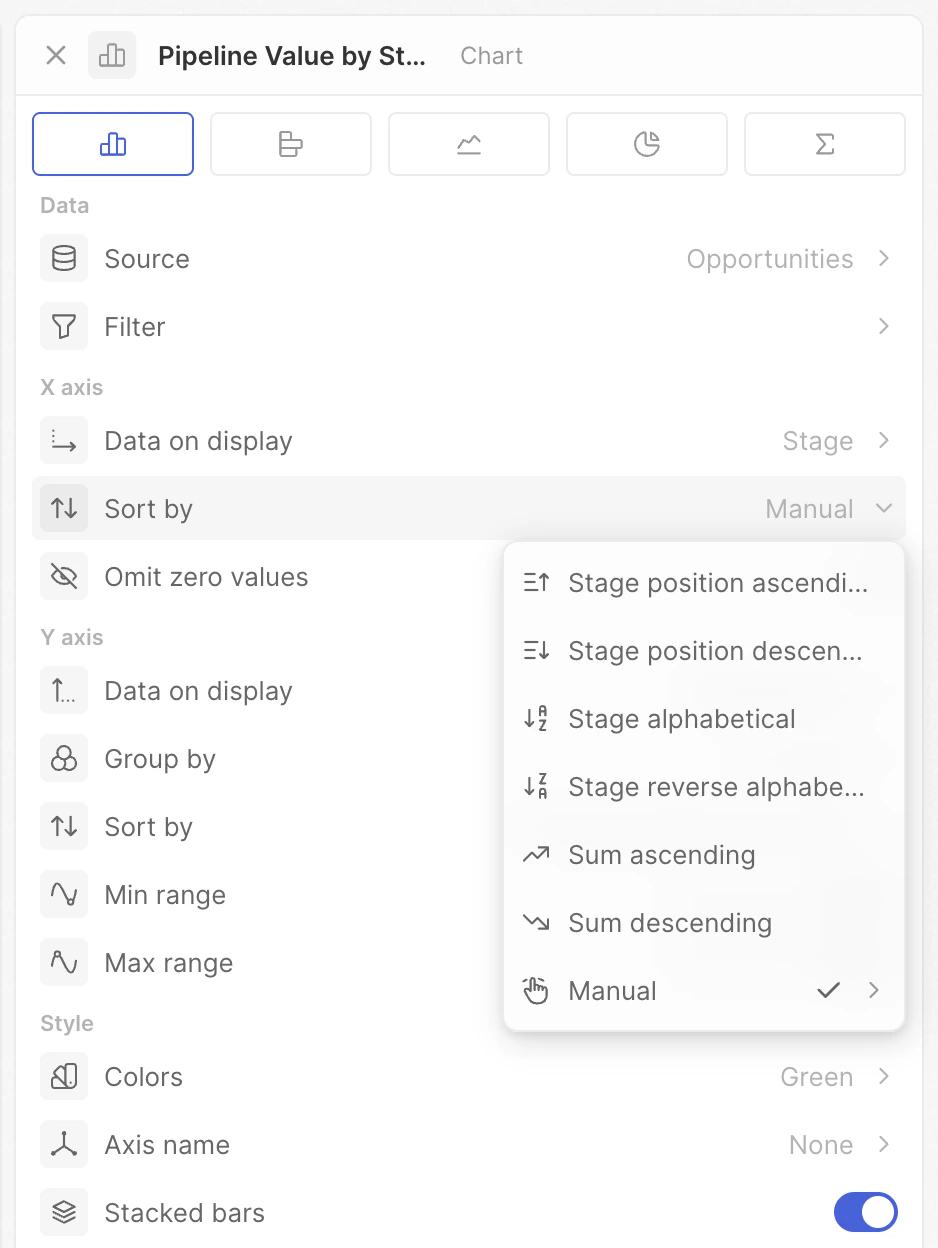
### <span style={{ display: 'inline-flex', alignItems: 'center', gap: '8px' }}> <ChartIcon icon="arrows-sort" />Ordenar por </span>

Controla el orden de las categorías en el eje X.

* **Posición** – usa el orden definido en la configuración de tu campo Select
* **Alfabético** – de la A a la Z (o cronológico para fechas)
* **Por valor** – ordenado por la métrica (el mayor o el menor primero)
* **Manual** – arrastra para definir tu propio orden

<img src="https://mintcdn.com/clara-1b8b12e1/nw6qFuBqeI4qyyh5/images/user-guide/dashboard/dashboard-chart-settings-x-sort.png?fit=max&auto=format&n=nw6qFuBqeI4qyyh5&q=85&s=7cca30332cc156f2e3aecfecbe14d03b" alt="Ordenar por" width="938" height="1248" data-path="images/user-guide/dashboard/dashboard-chart-settings-x-sort.png" />

**Consejo**: para las etapas del pipeline, usa **Posición** para mostrar las etapas en el orden de tu proceso de ventas (Lead → Qualified → Proposal → Won).

<Note>
  Las opciones mostradas dependen de tu tipo de campo. Los campos Select tienen todas las opciones; los campos de fecha y texto muestran menos.
</Note>

<Tip>
  Con el ordenamiento **Manual**, arrastra categorías para crear un orden personalizado—perfecto para destacar segmentos específicos o contar una historia con tus datos.
</Tip>

### <span style={{ display: 'inline-flex', alignItems: 'center', gap: '8px' }}> <ChartIcon icon="eye-off" />Omitir valores cero </span>

Oculta categorías que tienen cero o no tienen datos.

* **Activado**: las categorías sin registros se ocultan
* **Desactivado**: se muestran todas las categorías, incluso si están vacías

Úsalo para depurar gráficos con datos escasos.

***

## Configuración del eje Y

Estas configuraciones controlan qué estás midiendo y cómo se muestra.

### <span style={{ display: 'inline-flex', alignItems: 'center', gap: '8px' }}> <ChartIcon icon="axis-y" />Datos en pantalla </span>

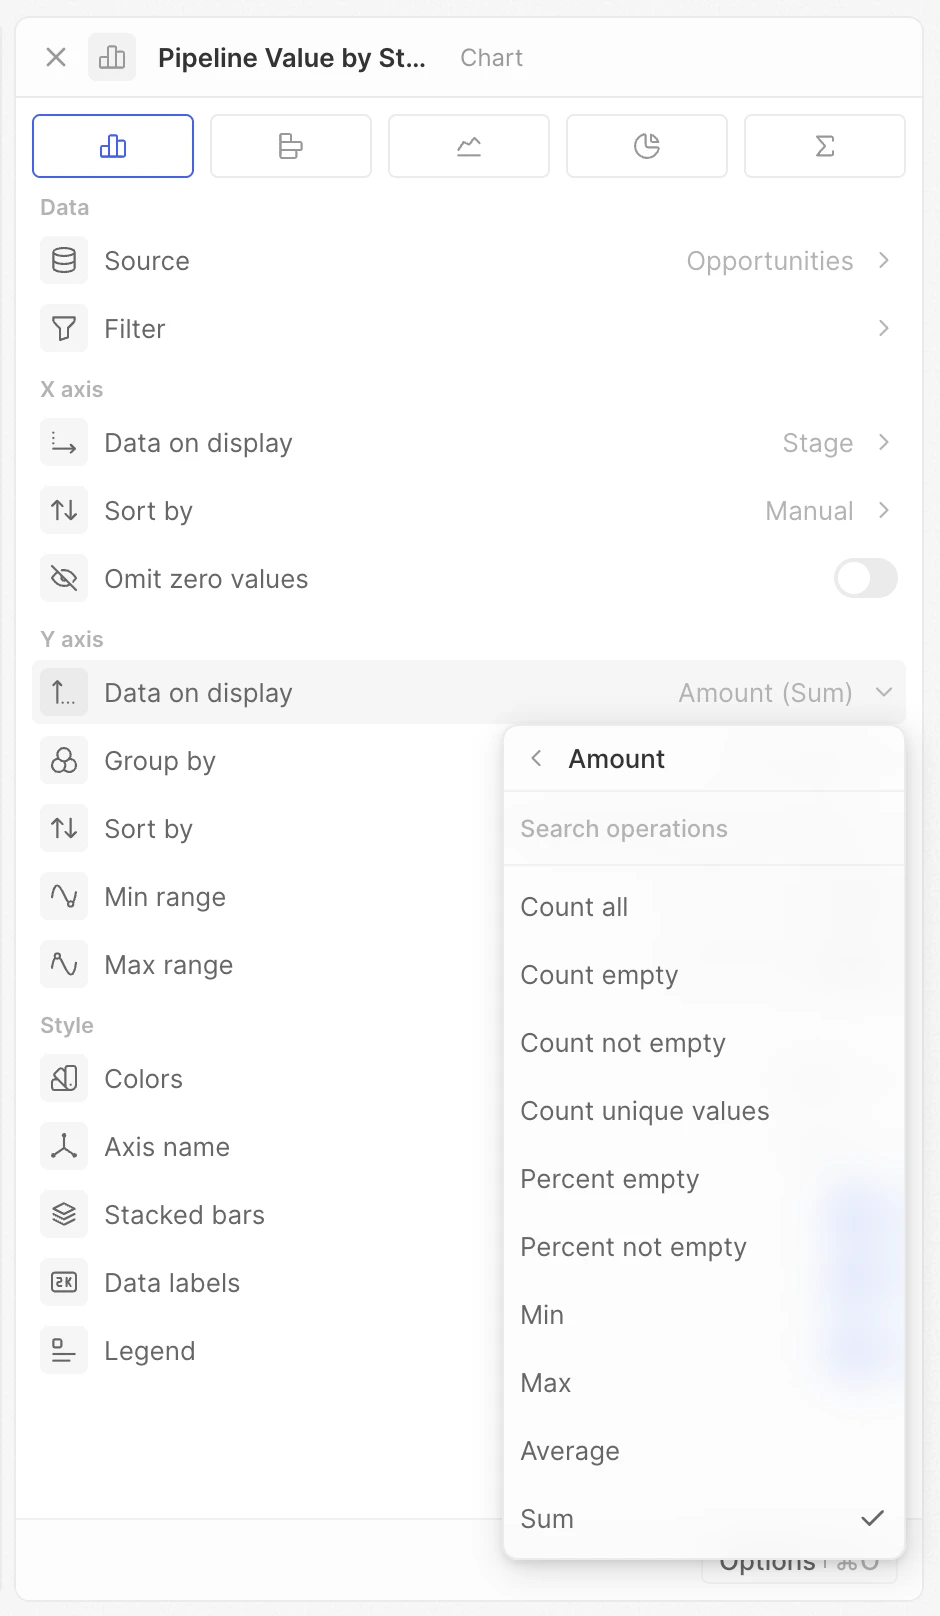
Selecciona el campo y la operación para calcular tu métrica.

* **Recuentos** – Contar todo, Contar vacíos, Contar no vacíos, Contar valores únicos
* **Matemáticas** – Suma, Promedio, Mín, Máx (campos numéricos)
* **Porcentajes** – Porcentaje de vacíos, Porcentaje de no vacíos

Los campos booleanos agregan Contar verdadero/falso. Los gráficos agregados con campos de fecha muestran el más antiguo/el más reciente.

**Ejemplo**: selecciona "Amount" con Suma para ver el valor total de acuerdos por categoría, o Contar todo para ver el número de acuerdos.

<img src="https://mintcdn.com/clara-1b8b12e1/nw6qFuBqeI4qyyh5/images/user-guide/dashboard/dashboard-chart-settings-y-data-on-display.png?fit=max&auto=format&n=nw6qFuBqeI4qyyh5&q=85&s=55e607195f09d382ba634cfcaa680b13" alt="Datos en pantalla" width="940" height="1616" data-path="images/user-guide/dashboard/dashboard-chart-settings-y-data-on-display.png" />

<Note>
  Las opciones mostradas dependen de tu campo y del tipo de gráfico. Si no ves una operación esperada, verifica tu tipo de campo.
</Note>

### Proporción

Para campos Select, Multi-select o Boolean, puedes calcular el porcentaje de un valor específico.

1. Selecciona un campo Select, Multi-select o Boolean
2. Activa **Ratio**
3. Elige la opción a medir

**Ejemplo**: muestra los acuerdos "Won" como porcentaje del total de oportunidades. Si tienes 10 Won de un total de 50, el gráfico muestra 20%.

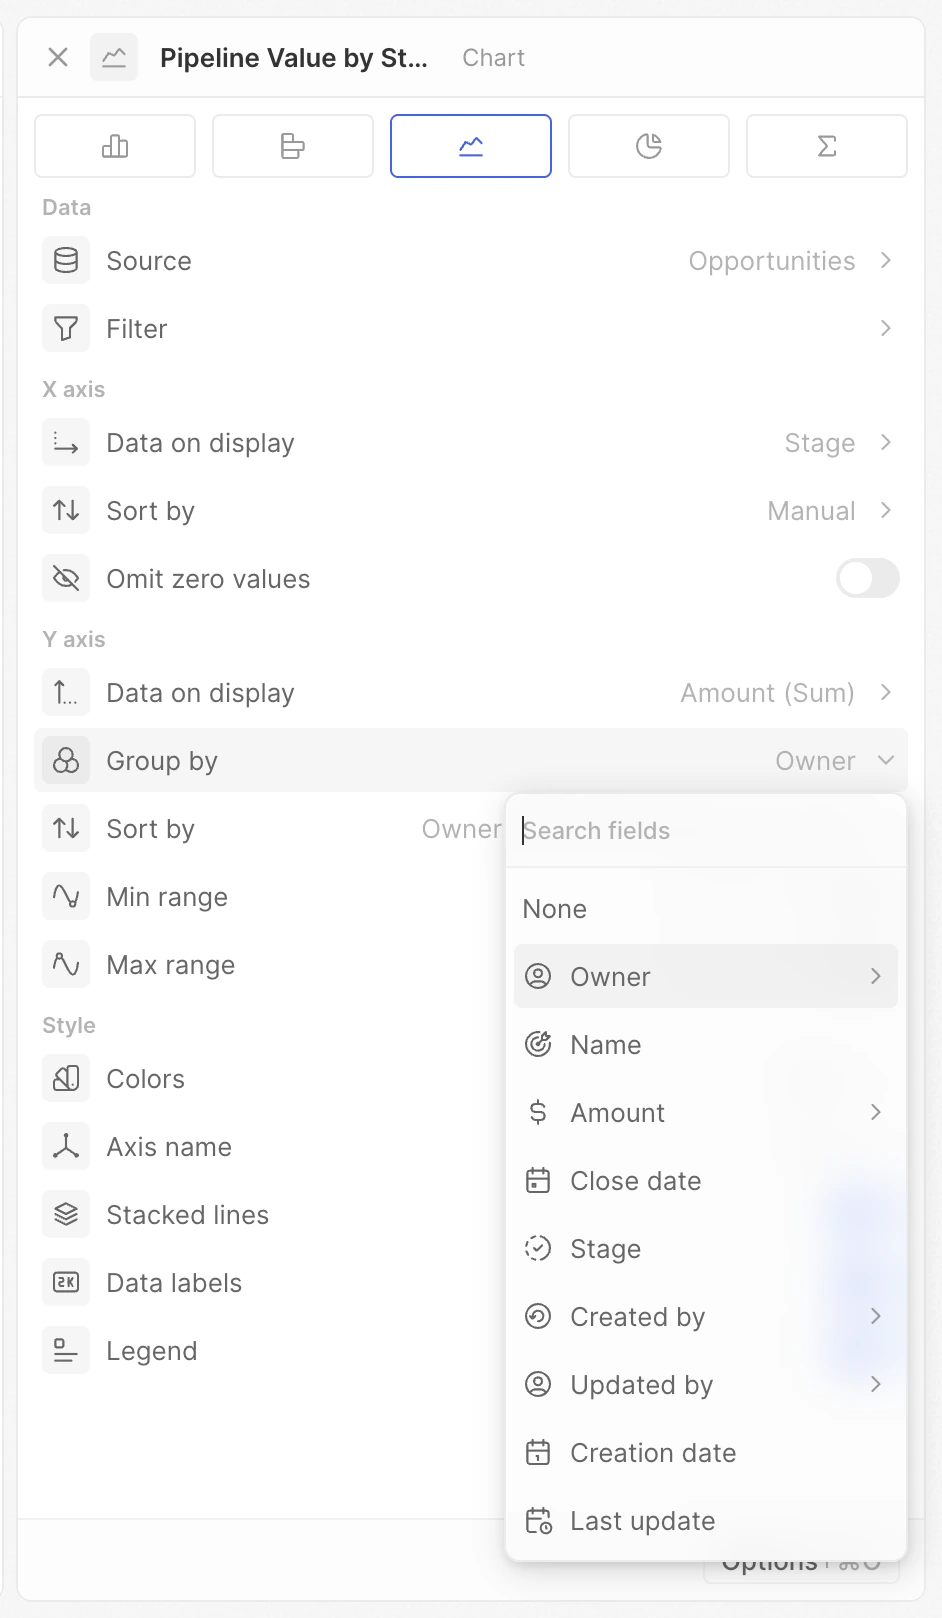
### <span style={{ display: 'inline-flex', alignItems: 'center', gap: '8px' }}> <ChartIcon icon="filters" />Agrupar por </span>

Agrega una segunda dimensión para crear múltiples series (múltiples barras o líneas).

1. Configura primero tu campo del eje X
2. Haz clic en **Group by**
3. Selecciona un segundo campo

**Ejemplo**: agrupa acuerdos por Stage (eje X) Y por Owner (Group by) para ver, lado a lado, el desglose del pipeline de cada persona.

<img src="https://mintcdn.com/clara-1b8b12e1/nw6qFuBqeI4qyyh5/images/user-guide/dashboard/dashboard-chart-settings-y-group-by.png?fit=max&auto=format&n=nw6qFuBqeI4qyyh5&q=85&s=75770edc506599ec7270d991ad75f64b" alt="Agrupar por" width="942" height="1618" data-path="images/user-guide/dashboard/dashboard-chart-settings-y-group-by.png" />

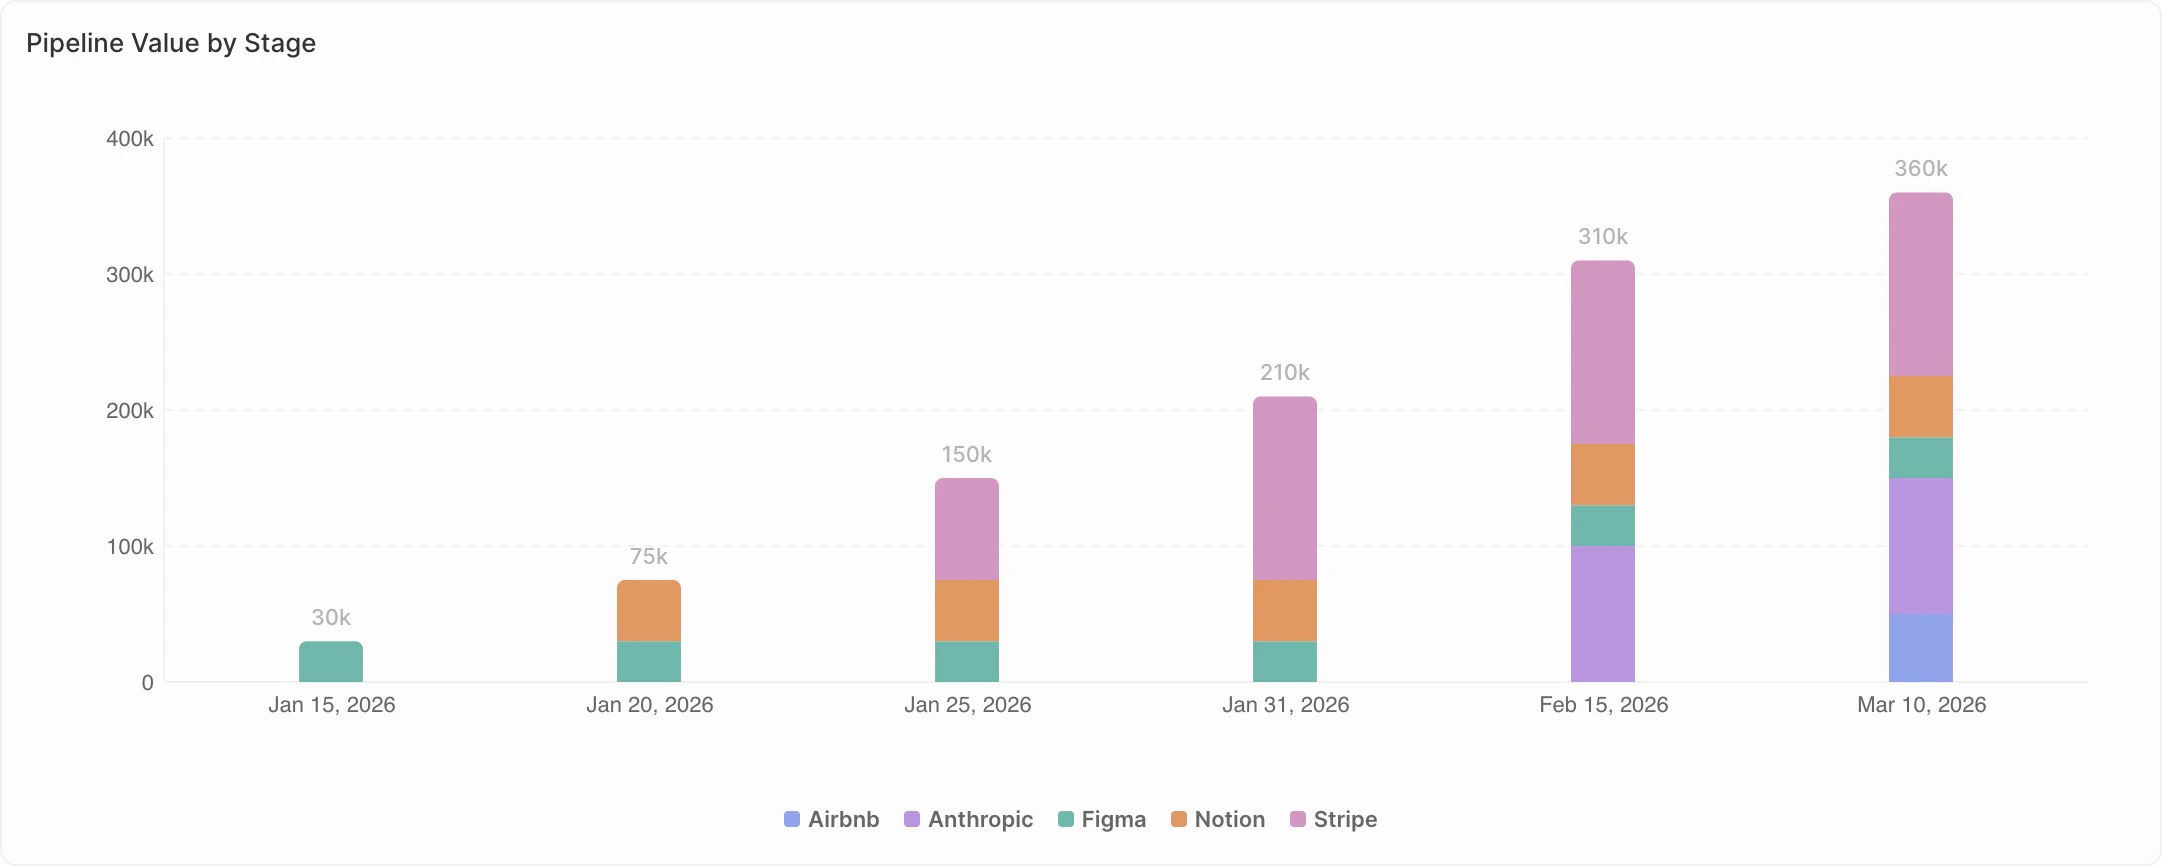
Cuando Group by está configurado, verás varios colores en tu gráfico y aparece una leyenda.

### <span style={{ display: 'inline-flex', alignItems: 'center', gap: '8px' }}> <ChartIcon icon="calendar" />Granularidad de fecha </span>

Cuando Group by es un campo de fecha, elige el período de tiempo (las mismas opciones que el eje X).

### <span style={{ display: 'inline-flex', alignItems: 'center', gap: '8px' }}> <ChartIcon icon="arrows-sort" />Ordenar por </span>

Cuando **Group by** está configurado, controla el orden de las series agrupadas (p. ej., qué barra de propietario aparece primero dentro de cada categoría).

Las mismas opciones que el orden del eje X—Posición, Alfabético y Manual—excepto que **el orden basado en valores no está disponible** para el agrupamiento secundario.

### <span style={{ display: 'inline-flex', alignItems: 'center', gap: '8px' }}> <ChartIcon icon="chart-bar-popular" />Acumulado </span>

Muestra totales acumulados en lugar de valores individuales.

* **Desactivado**: cada barra/punto muestra su propio valor
* **Activado**: cada barra/punto muestra la suma de todos los valores anteriores más el suyo

**Ejemplo**: enero = 10, febrero = 15

* Acumulado desactivado: muestra 10 y 15
* Acumulado activado: muestra 10 y 25 (10 + 15)

Usa el acumulado para hacer seguimiento del progreso hacia un objetivo a lo largo del tiempo.

<img src="https://mintcdn.com/clara-1b8b12e1/nw6qFuBqeI4qyyh5/images/user-guide/dashboard/dashboard-chart-settings-y-cumulative.png?fit=max&auto=format&n=nw6qFuBqeI4qyyh5&q=85&s=e8378fefec9080de8d2bc8d802501964" alt="Acumulado" width="2164" height="868" data-path="images/user-guide/dashboard/dashboard-chart-settings-y-cumulative.png" />

### <span style={{ display: 'inline-flex', alignItems: 'center', gap: '8px' }}> <ChartIcon icon="math-min" />Rango mínimo / <ChartIcon icon="math-max" />Rango máximo </span>

Establece valores mínimos y máximos fijos para el eje Y.

* Déjalo en blanco para el escalado automático
* Ingresa un número para fijar el límite

**Cuándo usarlo:**

* Establece Min en 0 para comparaciones visuales precisas
* Establece ambos para escalas consistentes en varios gráficos
* Enfócate en un rango de valores específico configurando ambos

***

## Configuración de estilo

### <span style={{ display: 'inline-flex', alignItems: 'center', gap: '8px' }}> <ChartIcon icon="color-swatch" />Colores </span>

Define la paleta de colores de tu gráfico. Elige entre una variedad de paletas de colores.

<Note>
  Al agrupar por un campo Select, el gráfico usa automáticamente los colores definidos para cada opción en la configuración de tu campo.
</Note>

### <span style={{ display: 'inline-flex', alignItems: 'center', gap: '8px' }}> <ChartIcon icon="gizmo" />Nombre del eje </span>

Elige qué etiquetas de eje mostrar: **Ninguna**, **Eje X**, **Eje Y** o **Ambos** (solo gráficos de barras y líneas).

### <span style={{ display: 'inline-flex', alignItems: 'center', gap: '8px' }}> <ChartIcon icon="stack-2" />Barras apiladas / Líneas apiladas </span>

Cuando Group by está configurado, elige cómo se muestran las múltiples series.

* **Desactivado (Agrupadas)**: las series aparecen una al lado de la otra. Úsalo al comparar valores exactos entre grupos.
* **Activado (Apiladas)**: las series se apilan una encima de otra. Úsalo al mostrar la composición—cómo las partes conforman un todo.

**Ejemplo**: acuerdos por etapa, agrupados por propietario

* Agrupadas: ve los números exactos de cada propietario uno al lado del otro
* Apiladas: ve los acuerdos totales por etapa, con la contribución de cada propietario apilada

### <span style={{ display: 'inline-flex', alignItems: 'center', gap: '8px' }}> <ChartIcon icon="badge-2k" />Etiquetas de datos </span>

Muestra valores directamente en los elementos del gráfico (barras, puntos, porciones).

* **Activado**: los valores aparecen en el gráfico
* **Desactivado**: no se muestran valores (apariencia más limpia)

### <span style={{ display: 'inline-flex', alignItems: 'center', gap: '8px' }}> <ChartIcon icon="text-caption" />Leyenda </span>

Muestra u oculta la leyenda (solo aparece cuando Group by está configurado).

* **Activado**: la leyenda muestra qué representa cada color
* **Desactivado**: no se muestra la leyenda

<Tip>
  **Pasa el cursor** sobre un elemento de la leyenda para resaltar ese grupo. **Haz clic** para ocultarlo temporalmente del gráfico.
</Tip>

***

## Notas específicas del gráfico

### Gráficos de pastel

* <span style={{ display: 'inline-flex', verticalAlign: 'middle' }}><ChartIcon icon="chart-pie" size={16} /></span> **Cada porción representa** – define cómo se agrupan las porciones
* <span style={{ display: 'inline-flex', verticalAlign: 'middle' }}><ChartIcon icon="eye-off" size={16} /></span> **Ocultar categoría vacía** – eliminar porciones con valor cero
* <span style={{ display: 'inline-flex', verticalAlign: 'middle' }}><ChartIcon icon="number-123" size={16} /></span> **Mostrar valor en el centro** – mostrar el valor agregado (suma, promedio, recuento, etc.)

### Gráficos agregados

* <span style={{ display: 'inline-flex', verticalAlign: 'middle' }}><ChartIcon icon="caret-left" size={16} /></span> **Prefijo** – agrega texto antes del número (p. ej., `$`)
* <span style={{ display: 'inline-flex', verticalAlign: 'middle' }}><ChartIcon icon="caret-right" size={16} /></span> **Sufijo** – agrega texto después del número (p. ej., `%`)