> ## Documentation Index
> Fetch the complete documentation index at: https://docs.get-clara.tech/llms.txt
> Use this file to discover all available pages before exploring further.

# Widget

> Esplora i tipi di widget e le opzioni di visualizzazione in Twenty.

export const ChartIcon = ({icon, size = 20}) => {
  const icons = {
    'database': <svg xmlns="http://www.w3.org/2000/svg" width={size} height={size} viewBox="0 0 24 24" fill="none" stroke="currentColor" strokeWidth="2" strokeLinecap="round" strokeLinejoin="round">
        <path stroke="none" d="M0 0h24v24H0z" fill="none" />
        <path d="M4 6a8 3 0 1 0 16 0a8 3 0 1 0 -16 0" />
        <path d="M4 6v6a8 3 0 0 0 16 0v-6" />
        <path d="M4 12v6a8 3 0 0 0 16 0v-6" />
      </svg>,
    'filter': <svg xmlns="http://www.w3.org/2000/svg" width={size} height={size} viewBox="0 0 24 24" fill="none" stroke="currentColor" strokeWidth="2" strokeLinecap="round" strokeLinejoin="round">
        <path stroke="none" d="M0 0h24v24H0z" fill="none" />
        <path d="M4 4h16v2.172a2 2 0 0 1 -.586 1.414l-4.414 4.414v7l-6 2v-8.5l-4.48 -4.928a2 2 0 0 1 -.52 -1.345v-2.227" />
      </svg>,
    'axis-x': <svg xmlns="http://www.w3.org/2000/svg" width={size} height={size} viewBox="0 0 24 24" fill="none" stroke="currentColor" strokeWidth="2" strokeLinecap="round" strokeLinejoin="round">
        <path stroke="none" d="M0 0h24v24H0z" fill="none" />
        <path d="M4 13v.01" />
        <path d="M4 9v.01" />
        <path d="M4 5v.01" />
        <path d="M17 20l3 -3l-3 -3" />
        <path d="M4 17h16" />
      </svg>,
    'axis-y': <svg xmlns="http://www.w3.org/2000/svg" width={size} height={size} viewBox="0 0 24 24" fill="none" stroke="currentColor" strokeWidth="2" strokeLinecap="round" strokeLinejoin="round">
        <path stroke="none" d="M0 0h24v24H0z" fill="none" />
        <path d="M11 20h-.01" />
        <path d="M15 20h-.01" />
        <path d="M19 20h-.01" />
        <path d="M4 7l3 -3l3 3" />
        <path d="M7 20v-16" />
      </svg>,
    'sum': <svg xmlns="http://www.w3.org/2000/svg" width={size} height={size} viewBox="0 0 24 24" fill="none" stroke="currentColor" strokeWidth="2" strokeLinecap="round" strokeLinejoin="round">
        <path stroke="none" d="M0 0h24v24H0z" fill="none" />
        <path d="M18 16v2a1 1 0 0 1 -1 1h-11l6 -7l-6 -7h11a1 1 0 0 1 1 1v2" />
      </svg>,
    'chart-pie': <svg xmlns="http://www.w3.org/2000/svg" width={size} height={size} viewBox="0 0 24 24" fill="none" stroke="currentColor" strokeWidth="2" strokeLinecap="round" strokeLinejoin="round">
        <path stroke="none" d="M0 0h24v24H0z" fill="none" />
        <path d="M10 3.2a9 9 0 1 0 10.8 10.8a1 1 0 0 0 -1 -1h-6.8a2 2 0 0 1 -2 -2v-7a.9 .9 0 0 0 -1 -.8" />
        <path d="M15 3.5a9 9 0 0 1 5.5 5.5h-4.5a1 1 0 0 1 -1 -1v-4.5" />
      </svg>,
    'chart-line': <svg xmlns="http://www.w3.org/2000/svg" width={size} height={size} viewBox="0 0 24 24" fill="none" stroke="currentColor" strokeWidth="2" strokeLinecap="round" strokeLinejoin="round">
        <path stroke="none" d="M0 0h24v24H0z" fill="none" />
        <path d="M4 19l16 0" />
        <path d="M4 15l4 -6l4 2l4 -5l4 4" />
      </svg>,
    'calendar': <svg xmlns="http://www.w3.org/2000/svg" width={size} height={size} viewBox="0 0 24 24" fill="none" stroke="currentColor" strokeWidth="2" strokeLinecap="round" strokeLinejoin="round">
        <path stroke="none" d="M0 0h24v24H0z" fill="none" />
        <path d="M4 7a2 2 0 0 1 2 -2h12a2 2 0 0 1 2 2v12a2 2 0 0 1 -2 2h-12a2 2 0 0 1 -2 -2v-12" />
        <path d="M16 3v4" />
        <path d="M8 3v4" />
        <path d="M4 11h16" />
        <path d="M11 15h1" />
        <path d="M12 15v3" />
      </svg>,
    'arrows-sort': <svg xmlns="http://www.w3.org/2000/svg" width={size} height={size} viewBox="0 0 24 24" fill="none" stroke="currentColor" strokeWidth="2" strokeLinecap="round" strokeLinejoin="round">
        <path stroke="none" d="M0 0h24v24H0z" fill="none" />
        <path d="M3 9l4 -4l4 4m-4 -4v14" />
        <path d="M21 15l-4 4l-4 -4m4 4v-14" />
      </svg>,
    'filters': <svg xmlns="http://www.w3.org/2000/svg" width={size} height={size} viewBox="0 0 24 24" fill="none" stroke="currentColor" strokeWidth="2" strokeLinecap="round" strokeLinejoin="round">
        <path stroke="none" d="M0 0h24v24H0z" fill="none" />
        <path d="M7 8a5 5 0 1 0 10 0a5 5 0 1 0 -10 0" />
        <path d="M8 11a5 5 0 1 0 3.998 1.997" />
        <path d="M12.002 19.003a5 5 0 1 0 3.998 -8.003" />
      </svg>,
    'chart-bar-popular': <svg xmlns="http://www.w3.org/2000/svg" width={size} height={size} viewBox="0 0 24 24" fill="none" stroke="currentColor" strokeWidth="2" strokeLinecap="round" strokeLinejoin="round">
        <path stroke="none" d="M0 0h24v24H0z" fill="none" />
        <path d="M3 13a1 1 0 0 1 1 -1h4a1 1 0 0 1 1 1v6a1 1 0 0 1 -1 1h-4a1 1 0 0 1 -1 -1l0 -6" />
        <path d="M9 9a1 1 0 0 1 1 -1h4a1 1 0 0 1 1 1v10a1 1 0 0 1 -1 1h-4a1 1 0 0 1 -1 -1l0 -10" />
        <path d="M15 5a1 1 0 0 1 1 -1h4a1 1 0 0 1 1 1v14a1 1 0 0 1 -1 1h-4a1 1 0 0 1 -1 -1l0 -14" />
        <path d="M4 20h14" />
      </svg>,
    'math-min': <svg xmlns="http://www.w3.org/2000/svg" width={size} height={size} viewBox="0 0 24 24" fill="none" stroke="currentColor" strokeWidth="2" strokeLinecap="round" strokeLinejoin="round">
        <path stroke="none" d="M0 0h24v24H0z" fill="none" />
        <path d="M15 18a2 2 0 1 0 4 0a2 2 0 0 0 -4 0" />
        <path d="M3 13s1 -9 4 -9c2.48 0 5.643 9.565 8.36 12.883" />
        <path d="M18.748 17.038c.702 -.88 1.452 -3.56 2.252 -8.038" />
      </svg>,
    'math-max': <svg xmlns="http://www.w3.org/2000/svg" width={size} height={size} viewBox="0 0 24 24" fill="none" stroke="currentColor" strokeWidth="2" strokeLinecap="round" strokeLinejoin="round">
        <path stroke="none" d="M0 0h24v24H0z" fill="none" />
        <path d="M5 6a2 2 0 1 0 4 0a2 2 0 0 0 -4 0" />
        <path d="M3 15s.616 -5.544 2.332 -7.93" />
        <path d="M8.637 7.112c2.717 3.313 5.882 12.888 8.363 12.888c2 0 3.333 -3 4 -9" />
      </svg>,
    'color-swatch': <svg xmlns="http://www.w3.org/2000/svg" width={size} height={size} viewBox="0 0 24 24" fill="none" stroke="currentColor" strokeWidth="2" strokeLinecap="round" strokeLinejoin="round">
        <path stroke="none" d="M0 0h24v24H0z" fill="none" />
        <path d="M19 3h-4a2 2 0 0 0 -2 2v12a4 4 0 0 0 8 0v-12a2 2 0 0 0 -2 -2" />
        <path d="M13 7.35l-2 -2a2 2 0 0 0 -2.828 0l-2.828 2.828a2 2 0 0 0 0 2.828l9 9" />
        <path d="M7.3 13h-2.3a2 2 0 0 0 -2 2v4a2 2 0 0 0 2 2h12" />
        <path d="M17 17l0 .01" />
      </svg>,
    'gizmo': <svg xmlns="http://www.w3.org/2000/svg" width={size} height={size} viewBox="0 0 24 24" fill="none" stroke="currentColor" strokeWidth="2" strokeLinecap="round" strokeLinejoin="round">
        <path stroke="none" d="M0 0h24v24H0z" fill="none" />
        <path d="M20 19l-8 -5.5l-8 5.5" />
        <path d="M12 4v9.5" />
        <path d="M11 4a1 1 0 1 0 2 0a1 1 0 1 0 -2 0" />
        <path d="M3 19a1 1 0 1 0 2 0a1 1 0 1 0 -2 0" />
        <path d="M19 19a1 1 0 1 0 2 0a1 1 0 1 0 -2 0" />
      </svg>,
    'stack-2': <svg xmlns="http://www.w3.org/2000/svg" width={size} height={size} viewBox="0 0 24 24" fill="none" stroke="currentColor" strokeWidth="2" strokeLinecap="round" strokeLinejoin="round">
        <path stroke="none" d="M0 0h24v24H0z" fill="none" />
        <path d="M12 4l-8 4l8 4l8 -4l-8 -4" />
        <path d="M4 12l8 4l8 -4" />
        <path d="M4 16l8 4l8 -4" />
      </svg>,
    'badge-2k': <svg xmlns="http://www.w3.org/2000/svg" width={size} height={size} viewBox="0 0 24 24" fill="none" stroke="currentColor" strokeWidth="2" strokeLinecap="round" strokeLinejoin="round">
        <path stroke="none" d="M0 0h24v24H0z" fill="none" />
        <path d="M3 7a2 2 0 0 1 2 -2h14a2 2 0 0 1 2 2v10a2 2 0 0 1 -2 2h-14a2 2 0 0 1 -2 -2l0 -10" />
        <path d="M14 9v6" />
        <path d="M17 9l-2 3l2 3" />
        <path d="M15 12h-1" />
        <path d="M7 9h2a1 1 0 0 1 1 1v1a1 1 0 0 1 -1 1h-1a1 1 0 0 0 -1 1v1a1 1 0 0 0 1 1h2" />
      </svg>,
    'text-caption': <svg xmlns="http://www.w3.org/2000/svg" width={size} height={size} viewBox="0 0 24 24" fill="none" stroke="currentColor" strokeWidth="2" strokeLinecap="round" strokeLinejoin="round">
        <path stroke="none" d="M0 0h24v24H0z" fill="none" />
        <path d="M4 15h16" />
        <path d="M4 5a1 1 0 0 1 1 -1h4a1 1 0 0 1 1 1v4a1 1 0 0 1 -1 1h-4a1 1 0 0 1 -1 -1l0 -4" />
        <path d="M4 20h12" />
      </svg>,
    'eye-off': <svg xmlns="http://www.w3.org/2000/svg" width={size} height={size} viewBox="0 0 24 24" fill="none" stroke="currentColor" strokeWidth="2" strokeLinecap="round" strokeLinejoin="round">
        <path stroke="none" d="M0 0h24v24H0z" fill="none" />
        <path d="M10.585 10.587a2 2 0 0 0 2.829 2.828" />
        <path d="M16.681 16.673a8.717 8.717 0 0 1 -4.681 1.327c-3.6 0 -6.6 -2 -9 -6c1.272 -2.12 2.712 -3.678 4.32 -4.674m2.86 -1.146a9.055 9.055 0 0 1 1.82 -.18c3.6 0 6.6 2 9 6c-.666 1.11 -1.379 2.067 -2.138 2.87" />
        <path d="M3 3l18 18" />
      </svg>,
    'caret-left': <svg xmlns="http://www.w3.org/2000/svg" width={size} height={size} viewBox="0 0 24 24" fill="none" stroke="currentColor" strokeWidth="2" strokeLinecap="round" strokeLinejoin="round">
        <path stroke="none" d="M0 0h24v24H0z" fill="none" />
        <path d="M14 6l-6 6l6 6v-12" />
      </svg>,
    'caret-right': <svg xmlns="http://www.w3.org/2000/svg" width={size} height={size} viewBox="0 0 24 24" fill="none" stroke="currentColor" strokeWidth="2" strokeLinecap="round" strokeLinejoin="round">
        <path stroke="none" d="M0 0h24v24H0z" fill="none" />
        <path d="M10 18l6 -6l-6 -6v12" />
      </svg>,
    'number-123': <svg xmlns="http://www.w3.org/2000/svg" width={size} height={size} viewBox="0 0 24 24" fill="none" stroke="currentColor" strokeWidth="2" strokeLinecap="round" strokeLinejoin="round">
        <path stroke="none" d="M0 0h24v24H0z" fill="none" />
        <path d="M3 10l2 -2v8" />
        <path d="M9 8h3a1 1 0 0 1 1 1v2a1 1 0 0 1 -1 1h-2a1 1 0 0 0 -1 1v2a1 1 0 0 0 1 1h3" />
        <path d="M17 8h2.5a1.5 1.5 0 0 1 1.5 1.5v1a1.5 1.5 0 0 1 -1.5 1.5h-1.5h1.5a1.5 1.5 0 0 1 1.5 1.5v1a1.5 1.5 0 0 1 -1.5 1.5h-2.5" />
      </svg>,
    'frame': <svg xmlns="http://www.w3.org/2000/svg" width={size} height={size} viewBox="0 0 24 24" fill="none" stroke="currentColor" strokeWidth="2" strokeLinecap="round" strokeLinejoin="round">
        <path stroke="none" d="M0 0h24v24H0z" fill="none" />
        <path d="M4 7l16 0" />
        <path d="M4 17l16 0" />
        <path d="M7 4l0 16" />
        <path d="M17 4l0 16" />
      </svg>,
    'align-box-left-top': <svg xmlns="http://www.w3.org/2000/svg" width={size} height={size} viewBox="0 0 24 24" fill="none" stroke="currentColor" strokeWidth="2" strokeLinecap="round" strokeLinejoin="round">
        <path stroke="none" d="M0 0h24v24H0z" fill="none" />
        <path d="M3 5a2 2 0 0 1 2 -2h14a2 2 0 0 1 2 2v14a2 2 0 0 1 -2 2h-14a2 2 0 0 1 -2 -2v-14" />
        <path d="M9 13h-2" />
        <path d="M13 10h-6" />
        <path d="M11 7h-4" />
      </svg>
  };
  const selectedIcon = icons[icon];
  if (!selectedIcon) {
    return null;
  }
  return selectedIcon;
};

## Widget disponibili

Twenty offre diversi tipi di widget per visualizzare i dati del tuo CRM.

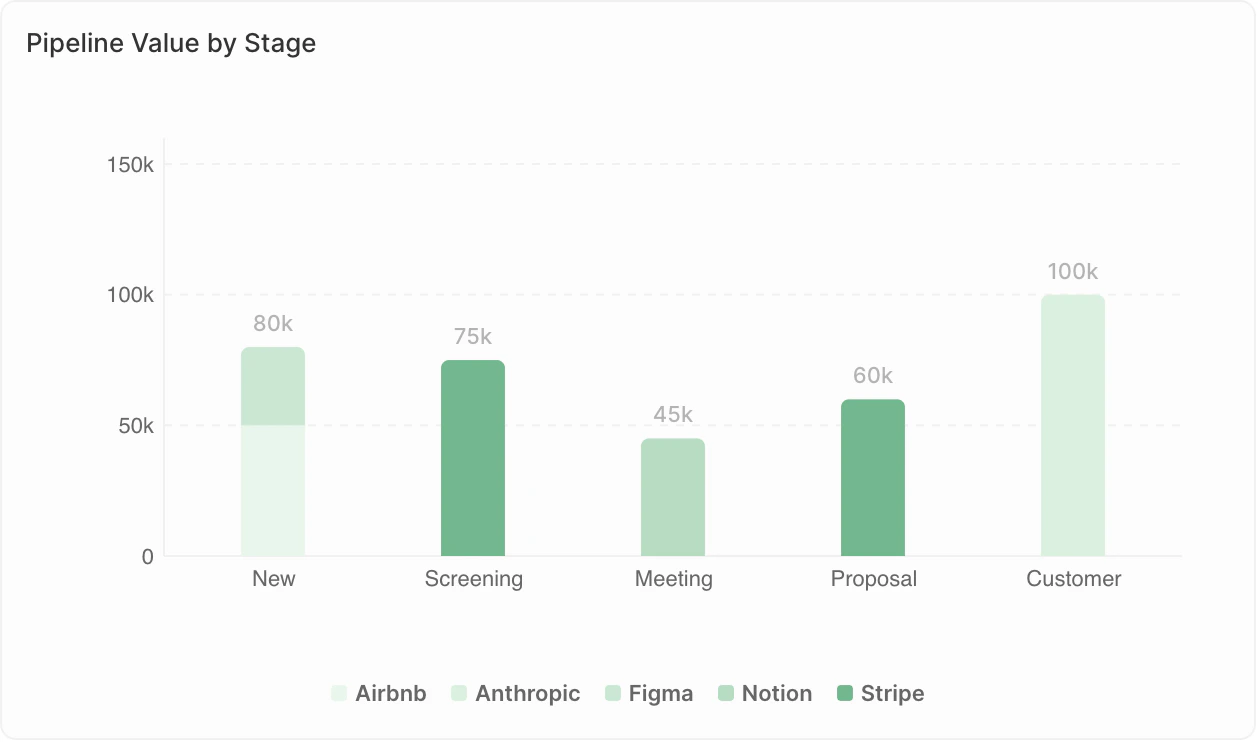
### <span style={{ display: 'inline-flex', alignItems: 'center', gap: '8px' }}><ChartIcon icon="chart-bar-popular" />Grafici a barre</span>

Mostra i dati come barre orizzontali o verticali.

<Frame>
  <img src="https://mintcdn.com/clara-1b8b12e1/nw6qFuBqeI4qyyh5/images/user-guide/dashboard/dashboard-widget-bar-chart.png?fit=max&auto=format&n=nw6qFuBqeI4qyyh5&q=85&s=776c421fc335595848132832861f504d" alt="Grafico a barre" width="1258" height="742" data-path="images/user-guide/dashboard/dashboard-widget-bar-chart.png" />
</Frame>

**Ideali per:**

* Confrontare i valori tra categorie
* Mostrare classifiche
* Monitorare le metriche per periodo di tempo

**Esempi di utilizzo:**

* Opportunità per fase
* Ricavi per rappresentante commerciale
* Contatti aggiunti per mese

<Note>
  **Limiti di visualizzazione**: I grafici a barre possono mostrare al massimo 100 barre e, quando si usa Raggruppa per, 50 gruppi per barra. Se visualizzi l'avviso "Undisplayed data: max X bars per chart", aggiungi filtri per restringere i dati o modifica il raggruppamento (ad es., raggruppa per settimana invece che per giorni).
</Note>

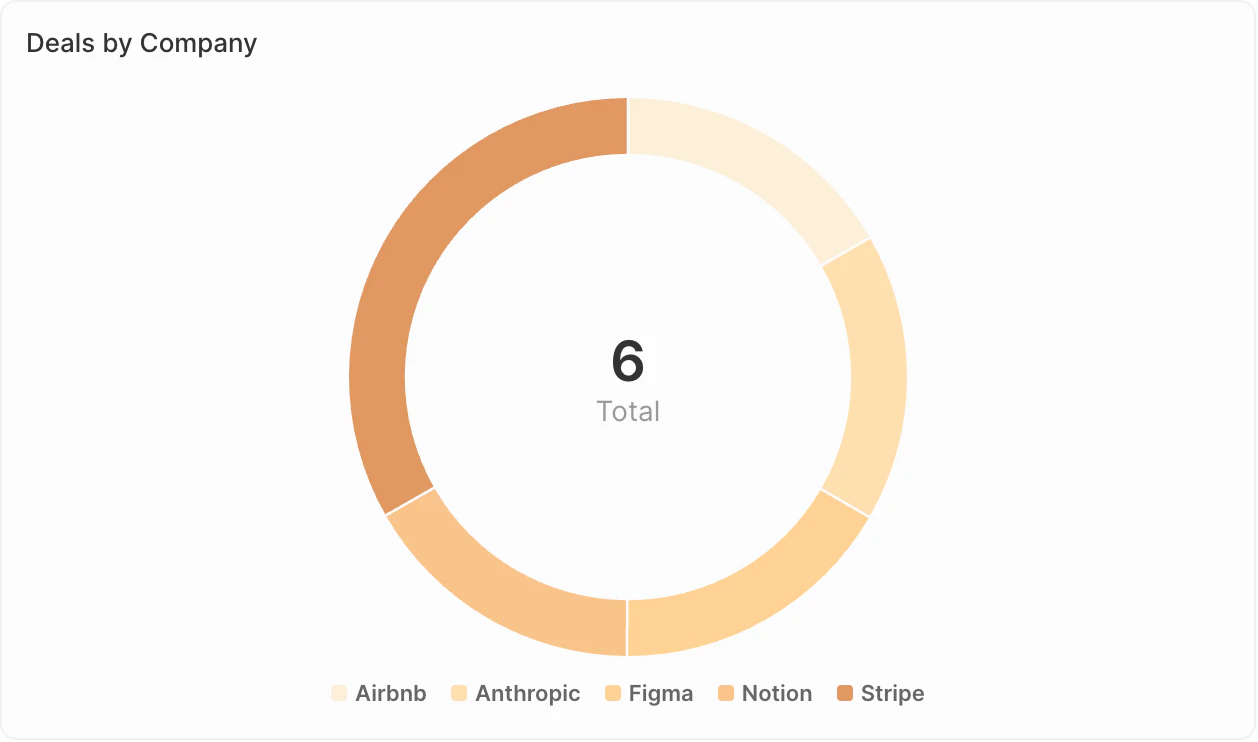
### <span style={{ display: 'inline-flex', alignItems: 'center', gap: '8px' }}><ChartIcon icon="chart-pie" />Grafici a torta</span>

Mostra le proporzioni del totale.

<Frame>
  <img src="https://mintcdn.com/clara-1b8b12e1/nw6qFuBqeI4qyyh5/images/user-guide/dashboard/dashboard-widget-pie-chart.png?fit=max&auto=format&n=nw6qFuBqeI4qyyh5&q=85&s=d778d58384087f33f803ebd811cd0655" alt="Grafico a torta" width="1258" height="742" data-path="images/user-guide/dashboard/dashboard-widget-pie-chart.png" />
</Frame>

**Ideali per:**

* Mostrare composizione o distribuzione
* Confrontare le parti con il totale
* Evidenziare i segmenti principali

**Esempi di utilizzo:**

* Distribuzione delle opportunità per fonte
* Ripartizione dei contatti per settore
* Composizione della pipeline per proprietario

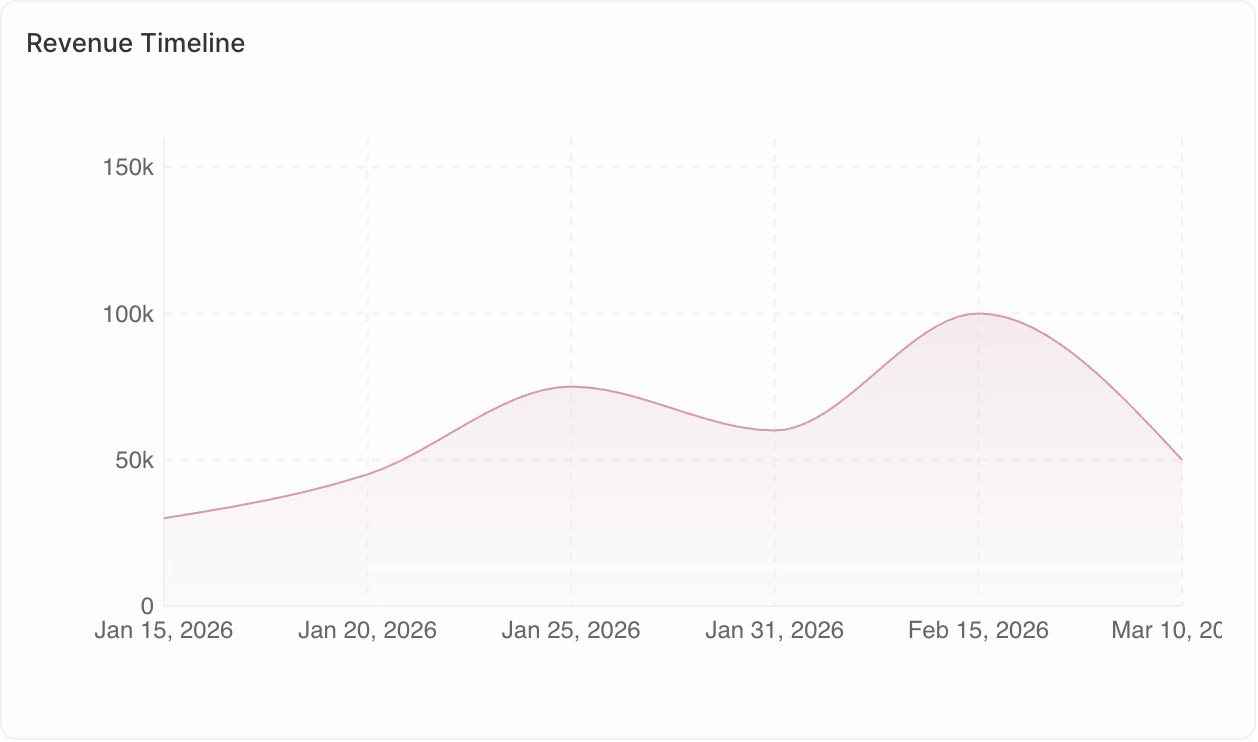
### <span style={{ display: 'inline-flex', alignItems: 'center', gap: '8px' }}><ChartIcon icon="chart-line" />Grafici a linee</span>

Mostra le tendenze nel tempo.

<Frame>
  <img src="https://mintcdn.com/clara-1b8b12e1/nw6qFuBqeI4qyyh5/images/user-guide/dashboard/dashboard-widget-line-chart.png?fit=max&auto=format&n=nw6qFuBqeI4qyyh5&q=85&s=82b2c3c2cc12ffd9c6d6c03aa11824a7" alt="Grafico a linee" width="1258" height="742" data-path="images/user-guide/dashboard/dashboard-widget-line-chart.png" />
</Frame>

**Ideali per:**

* Monitorare i cambiamenti nel tempo
* Individuare le tendenze
* Confrontare più metriche

**Esempi di utilizzo:**

* Andamento mensile del numero di opportunità
* Crescita dei ricavi per trimestre
* Livelli di attività nel tempo

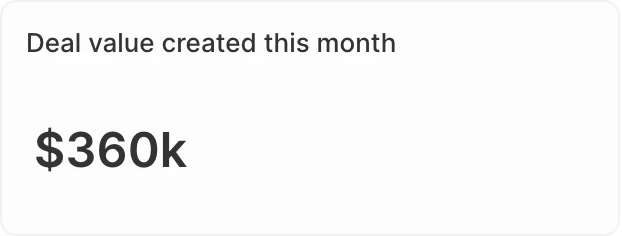
### <span style={{ display: 'inline-flex', alignItems: 'center', gap: '8px' }}><ChartIcon icon="sum" />Grafici aggregati</span>

Mostra in evidenza singoli valori chiave.

<Frame>
  <img src="https://mintcdn.com/clara-1b8b12e1/nw6qFuBqeI4qyyh5/images/user-guide/dashboard/dashboard-widget-aggregate-chart.png?fit=max&auto=format&n=nw6qFuBqeI4qyyh5&q=85&s=f0053a2f5740b6b1d51477a91c51686e" alt="Grafico aggregato" width="622" height="236" data-path="images/user-guide/dashboard/dashboard-widget-aggregate-chart.png" />
</Frame>

**Ideali per:**

* Mettere in evidenza i KPI
* Mostrare totali o medie
* Controlli rapidi dello stato

**Esempi di utilizzo:**

* Valore totale della pipeline
* Numero di opportunità aperte
* Tasso di conversione

**Opzioni avanzate:**

* **Rapporto**: Per i campi di tipo Select, calcola i rapporti tra i valori. Vai a **Dati visualizzati** → seleziona il tuo campo → abilita l'opzione **Rapporto**.
* **Prefisso e suffisso**: Aggiungi un testo personalizzato prima o dopo il numero (ad es., prefisso "\$" o suffisso "%") per una migliore leggibilità.

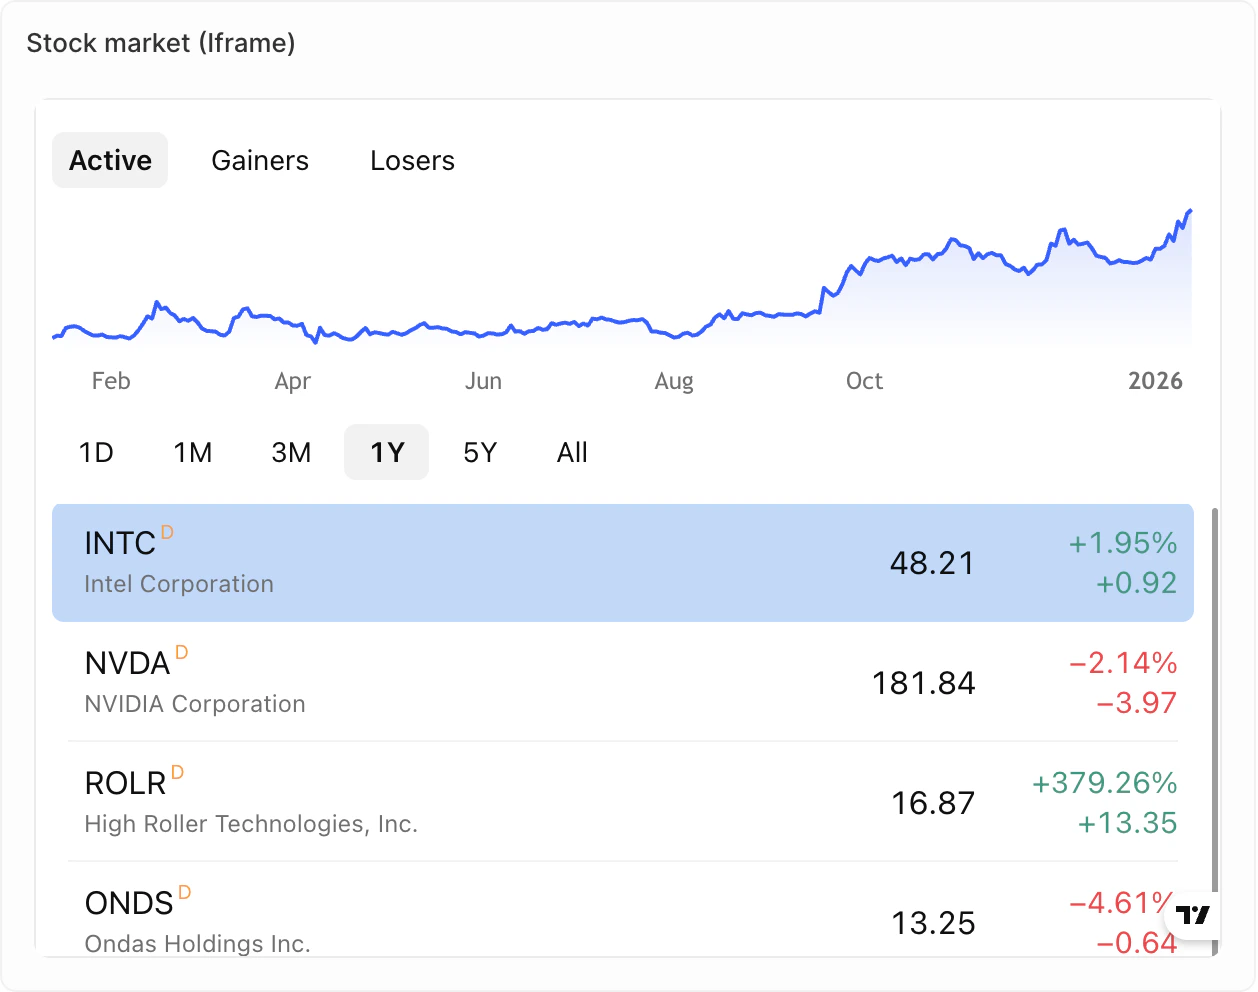
### <span style={{ display: 'inline-flex', alignItems: 'center', gap: '8px' }}><ChartIcon icon="frame" />iFrames</span>

Incorpora strumenti e contenuti esterni direttamente nella tua dashboard.

<Frame>
  <img src="https://mintcdn.com/clara-1b8b12e1/nw6qFuBqeI4qyyh5/images/user-guide/dashboard/dashboard-widget-iframe.png?fit=max&auto=format&n=nw6qFuBqeI4qyyh5&q=85&s=5ef35fb4b39ecbc047f2efd54109ec12" alt="iFrame" width="1258" height="992" data-path="images/user-guide/dashboard/dashboard-widget-iframe.png" />
</Frame>

**Ideali per:**

* Visualizzare report o dashboard esterni
* Integrare strumenti di vendita di terze parti
* Mostrare contenuti in tempo reale da altri sistemi

**Esempi di utilizzo:**

* Metriche dal tuo strumento di assistenza
* Metriche dal tuo dialer
* Contenuti in tempo reale dal tuo strumento per sequenze di vendita

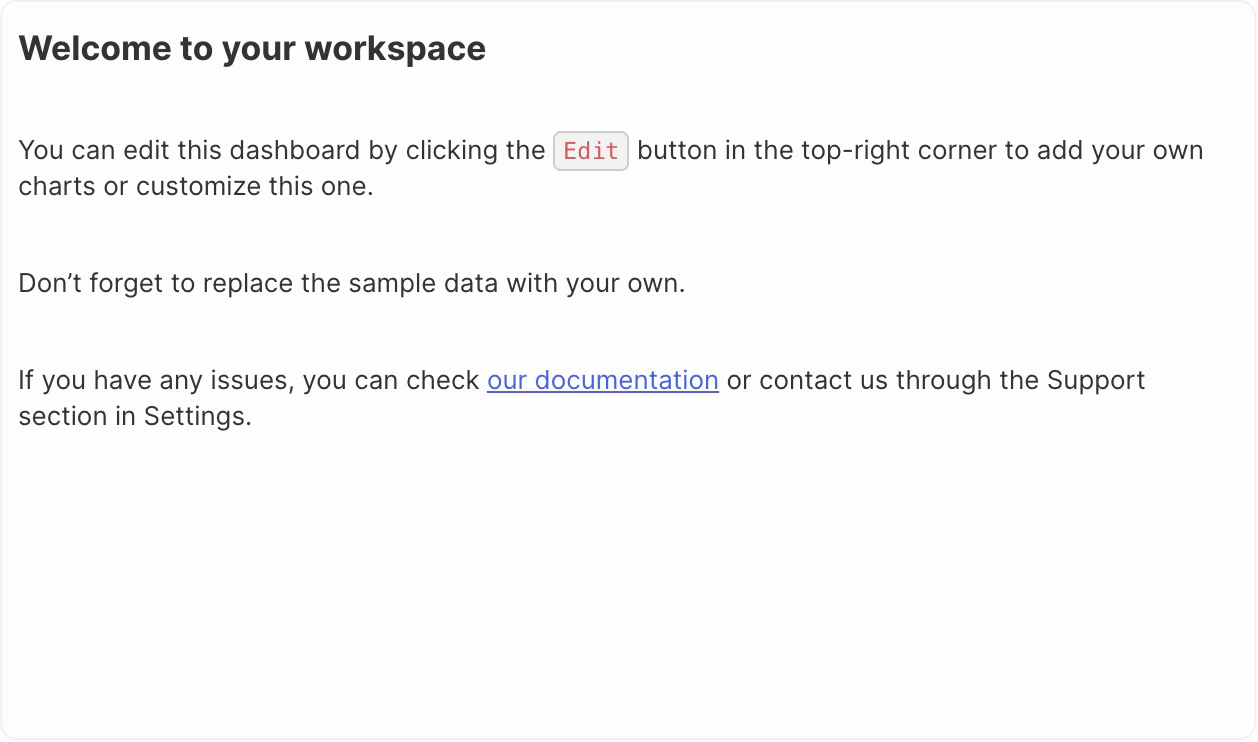
### <span style={{ display: 'inline-flex', alignItems: 'center', gap: '8px' }}><ChartIcon icon="align-box-left-top" />Testo formattato</span>

Aggiungi testo formattato e contenuti direttamente alla tua dashboard.

<Frame>
  <img src="https://mintcdn.com/clara-1b8b12e1/nw6qFuBqeI4qyyh5/images/user-guide/dashboard/dashboard-widget-rich-text.png?fit=max&auto=format&n=nw6qFuBqeI4qyyh5&q=85&s=1e2bdf0bd2e9da7cf5d5d1dcccbad1b1" alt="Testo formattato" width="1258" height="742" data-path="images/user-guide/dashboard/dashboard-widget-rich-text.png" />
</Frame>

**Ideale per:**

* Aggiunta di contesto o istruzioni
* Descrizioni della dashboard
* Note e annotazioni

**Funzionalità:**

* Formattazione del testo (grassetto, corsivo, elenchi, ecc.)
* Caricamento di immagini e file
* Modifica in stile Markdown

<Note>
  **In arrivo**: I grafici a indicatore e le tabelle non sono ancora disponibili ma sono nella nostra roadmap.
</Note>

### Duplicazione dei widget

1. Fai clic sul widget
2. Apri **Opzioni**
3. Fai clic su **Duplica widget**